1 Sustainability in the Built Environment
This chapter introduces the need for infrastructure, the problem of sustainability, and the concept of sustainable infrastructure.
1.1 Stewardship for Creation
Learning Outcomes
- Define the philosophy of Stewardship and discuss the role of human creation on Earth
- Describe elements of the Hannover Principles and how they overlap with Stewardship
Latter-day Saints believe that Heavenly Father created the earth and everything on it so that humans could get a body, experience joy and sorrow, and choose to follow Jesus Christ. The Earth and its resources therefore serve a sacred purpose. Humans have been given “dominion” over these resources and agency for their use. We can apply these resources to design, construct, and operate a built environment — homes, offices, factories, roads, parks, water systems, power systems, neighborhoods, towns, cities, etc. — to improve the quality of life of God’s children.
Bishop Gérald Caussé clarified this idea further:
In gospel terms, the word stewardship designates a sacred spiritual or temporal responsibility to take care of something that belongs to God for which we are accountable. Our stewardship over God’s creations … includes, at its pinnacle, a sacred duty to love, respect, and care for all human beings with whom we share the earth. They are sons and daughters of God, our sisters and our brothers, and their eternal happiness is the very purpose of the work of creation.
Although many religious traditions believe in a divine Creation, truths restored by Joseph Smith and subsequent prophets clarify certain aspects of the Creation. Some of these unique Latter-day Saint doctrines include the following: 1
- The Earth was created from preexisting matter
- The Creation may have taken a long time
- We helped with the Creation
- The Earth and all its creatures have spirits
- The Celestial Kingdom will be on Earth
- The Fall was an intentional part of God’s plan
These doctrines underline the importance of caring for the Earth and using its resources in a responsible way to bless others. After all, if the Earth will become the place where we live forever with Jesus Christ and our families, perhaps preparing for His return will involve cleaning the Earth and beautifying its environments.
Think
Consider this exercise from the Gospel Topics essay on Environmental Stewardship and Conservation
Learn, ponder, and pray about what you can do to be a better steward. Use the resources of the earth sparingly and reverently. Adopt lifestyles and personal habits that respect the Creation. As you can, fix up and keep clean the places where you live, work, recreate, and worship. Make your own living space more beautiful and inspirational. Contemplate the ways that nature bears testimony of God and the harmony between the laws and patterns of nature and the gospel of Jesus Christ.
Many of these same ideas of stewardship are recognized by thoughtul people from other religious traditions, including secular traditions. The Hannover Principles, were developed for the 2000 World’s Fair as a foundation for Ecological Design. The principles are:
- Insist on the rights of humanity and nature to coexist
- Recognize interdependence
- Respect relationships between spirit and matter
- Accept responsibility for the consequences of design
- Create safe objects of long-term value
- Eliminate the concept of waste
- Rely on natural energy flows
- Understand the limitations of design
- Seek constant improvements by the sharing of knowledge
Throughout this course we will consider how we can implement principles of stewardship as they relate to the built environment.
Think
Consider the Hannover Principles in light of what you hope to do in your career and what you believe about the Earth and Creation. Are there any of the principles that you disagree with? Which of them do you think will be hardest to implement in your life or your work?
1.2 Built Environments
Learning Outcomes
- Discuss the role of built environments on human well-being
- Understand the attributes of a system, and describe how infrastructure works as a system
- Discuss the components of good infrastructure using the ASCE Infrastructure Report Card rating system.
- Understand the four R’s of resilience, and how they impact the reslience curve
The earth is central to God’s plan for His children to gain earthly experience. As part of that plan, we are to transform, create, and build using the earth’s raw resources to sustain life on earth. Thomas S. Monson taught:
God left the world unfinished for [men and women] to work [their] skill upon. He left the electricity in the cloud, the oil in the earth. He left the rivers unbridged and the forests unfelled and the cities unbuilt. God gives to [us] the challenge of raw materials, not the ease of finished things. He leaves the pictures unpainted and the music unsung and the problems unsolved, that [we] might know the joys and glories of creation.
The facilities we build for society — roads, homes, offices, churches, schools, dams, sewers, aqueducts, tunnels, ports, power plants, bridges, roads, etc. — are collectively referred to as the built environment. A closely related term is infrastructure; we will use these two terms interchangeably in this course.
The pre-fix “infra-” means below or underneath. Thus, the word infrastructure initally referered to the underlying framework upon which the built-environment is built, including both underground utilities (sewer, gas pipelines, roads), and above-ground structures (such as such as power lines, bridges, and buildings).
One important aspect of infrastructure is that it is a system, or a “group of interacting components that work together to achieve some common purpose.(Vanek et al. 2014)”. Each system has the following attributes:
- Purpose
- Components and subsystems
- Exists within a larger system
An important aspect of a infrastructure system is that the system is more valuable than the sum of its components. If the components are not functional or not working together, the components and system has no value. But if they are connected and working correctly they can provide tremendous value. Collectively providing drinking water and sewer services in a city with a water and sewer system is safer and more efficient than if each household provided their own drinking water with a well and sewer services with a septic system.
Infrastructure systems

Identify several infrastructure subsystems shown in Figure 1.1. Describe the purpose, components, and larger system associated with one subsystem.
There are many potential systems visible in this graphic. An non-exhaustive list of systems includes:
- The Roadway itself (road base, pavement, and curb)
- Storm water system
- Sanitary Sewer system
- Water delivery system
- Electric power system
- Gas delivery system
- Road network
- Telecommunication system
- Sidewalks and bike lanes
- Park
Let’s discuss the purpose, components, and larger system associated with the storm water subsystem.
- Purpose: Collect and drain storm water from city streets
- Key componenets: Gutters, storm drains, pipes, retention ponds, wetlands
- Larger System: Storm water systems are part of the sewer system, and the infrastructure for a city. The storm water system may also feed into a natural river system. (Copilot 2023)
The definition for infrastructure we use in this course, emphasizes that infrastructure is a collection of many systems working together:
Infrastructure is a system of systems or a “metasystem” that supports the daily needs of people, communities, and nations. Infrastructure includes the people, physical structures and information networks that help society function safely and efficiently. (Fields, Hart, and McBurnett 2024)
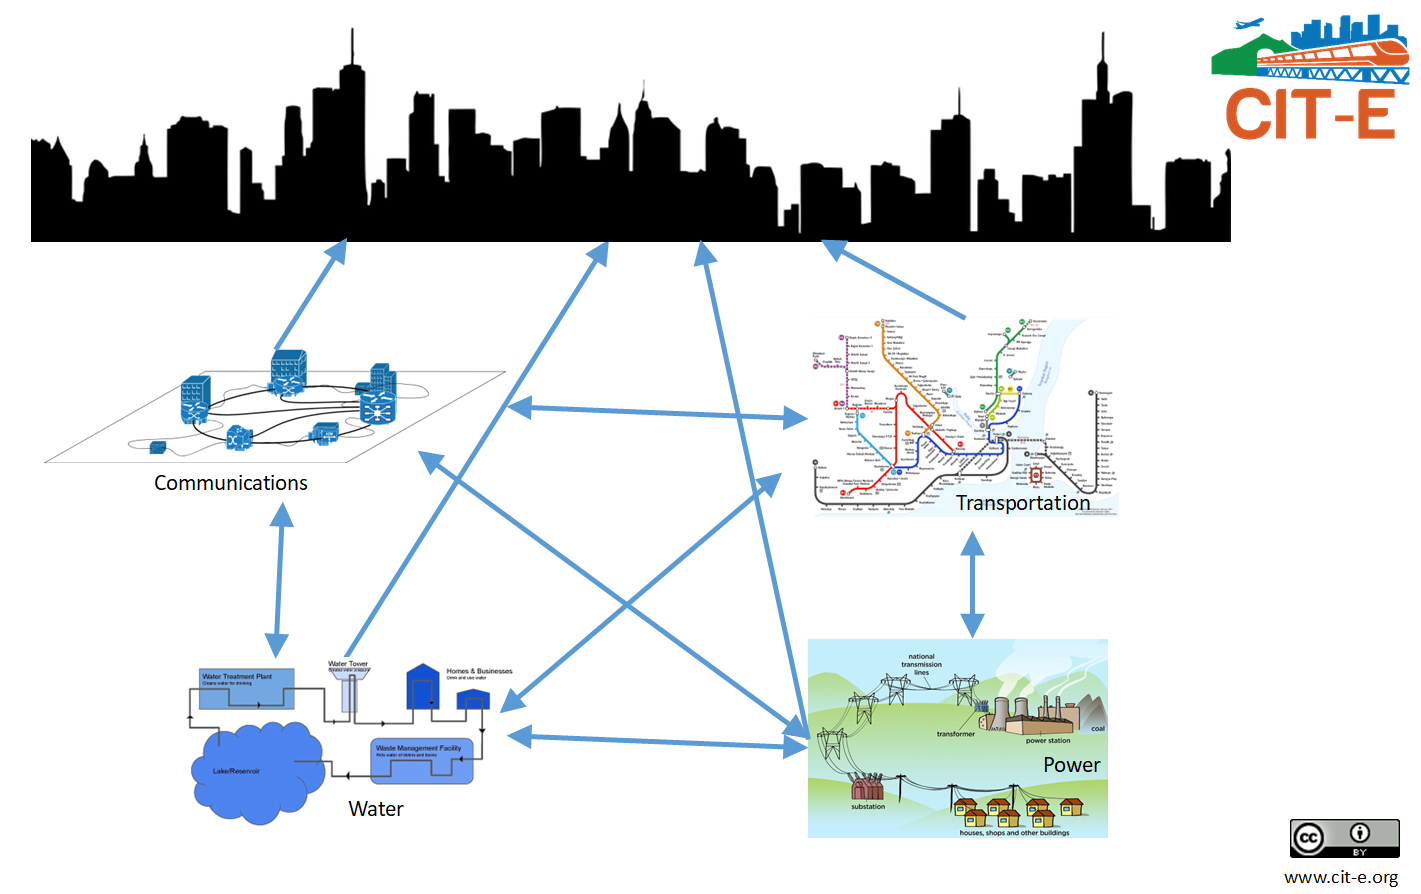
Each infrastrucure system is inter-dependent on the other systems. For example, Figure 1.2 shows four infrastructure systems that supports a city. Each of the systems is dependent on the other. The water, electricity, and communication systems are built within the roadway, which connects to the buildings in the city (See Figure 1.2). In turn, the transportation system relies on the communications, power and water system to work correctly. The communication system is needed to coordinate trains and traffic lights, the power system is needed to power the subway trains, traffic, and street lights, and the water system is needed to remove storm water from the subway and roadway. These are just four of the many infrastructure systems at work in a city. The efficiency that is obtained from multiple infrastructure systems working together, permits us to work more productively and live healthy lives or as said above help society function safely and efficiently.
1.2.1 Evaluating the Built Environment
How do we evaluate the quality of the built environment? The American Society of Civil Engineers (ASCE) publishes an Infrastructure Report Card every four years. They rate the US infrastructure using the following criteria:
- Capacity: Does the infrastructure’s capacity meet current and future demands?
- Condition: What is the infrastructure’s existing and near-future physical condition?
- Funding: What is the current level of funding from all levels of government for the infrastructure category as compared to the estimated funding need?
- Future Need: What is the cost to improve the infrastructure? Will future funding prospects address the need?
- Operation and Maintenance: What is the owners’ ability to operate and maintain the infrastructure properly? Is the infrastructure in compliance with government regulations?
- Public Safety: To what extent is the public’s safety jeopardized by the condition of the infrastructure and what could be the consequence of failure?
- Resilience: What is the infrastructure system’s capability to prevent or protect against significant multi-hazard threats and incidents? How able is it to quickly recover and reconstitute critical services with minimum consequences to public safety and health, the economy, and national security?
- Innovation: What new and innovative techniques, materials, technologies, and delivery methods are being implemented to improve the infrastructure?
These criteria help us to evaluate how well each system of infrastructure can conduct its purpose.
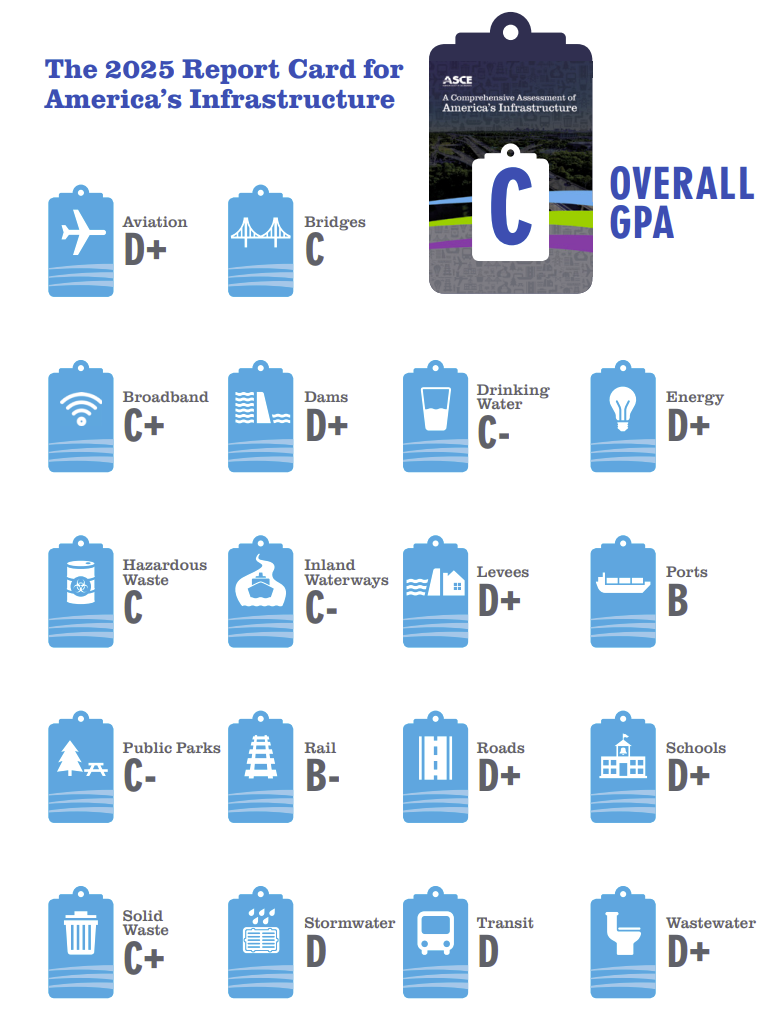
The most recent ASCE report card for US infrastructure is shown in Figure 1.3. According to the ASCE, the United States overall is given a C, with infrastructure subsystems given a range of grades. It’s important to point out that the purpose of this report card is to lobby government to spend money on infrastructure projects, thereby benefiting built environment professionals. But the fact remains that many of the facilities collectively comprising America’s infrastructure are not getting any younger, and will need repair or replacement in the near term.
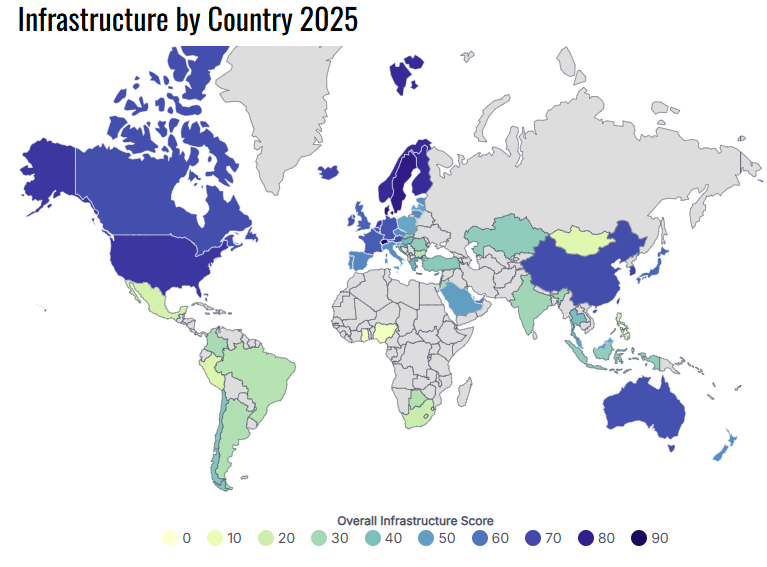
From an international (and non-lobbyist) perspective, the infrastructure in the US compares well to other countries (see Figure 1.4). The IMD World Competitiveness Ranking ranks the US 7th out of 67 evaluated countries. The rankings are based on the state of the current infrastructure and the ability of the country to meet future demands of their infrastructure (World Population Review 2025).
Think
If you are from a different country, or have spent time in an international country, how did the infrastructure in that country compare to the US? What advantages or disadvantages exist? What do you think leads to these advantages or challenges?
1.2.2 Resilience
Resilience is an important aspect of infrastructure systems.
Resilience is the ability to either withstand a hazard event or recover quickly with minimal disruption of service (Penn and Boston 2020).
A resilient infrastructure system has built-in redundancies to prevent failure or can recover quickly from failure. For example, a back-up generator is a redundant power system at a hospital in case the city power grid goes down. This makes the hospital’s power system resilient. In contrast, a vulnerable infrastructure system has critical components that are prone to failure, and have no redundancies.
The Center for Infrastructure Transformation & Education (CIT-E) has adopted the 4 R’s of resilience framework introduced by earthquake engineering researchers (Bruneau et al. 2003) as shown in Table 1.1.
| R of Resilience | Definition | Example |
|---|---|---|
| Robustness | ability to withstand stress without loss of service | Commercial buildings built to strong building codes will experience less damage in an earthquake, allowing businesses to continue operating after an earthquake |
| Redundancy | back-up or alternates to provide service | Multiple bridges across a river enables the two sides to be connected in the event that one is put out of service |
| Rapidity | ability to quickly bring back service | Utility personnel from a neighboring state help repair the electric grid after a winter storm downs hundreds of powerlines |
| Resourcefulness | using material and human available resources creatively, effectively, and adaptively | A city uses an emergency committee and plan to cordinate and prioritize recovery efforts |
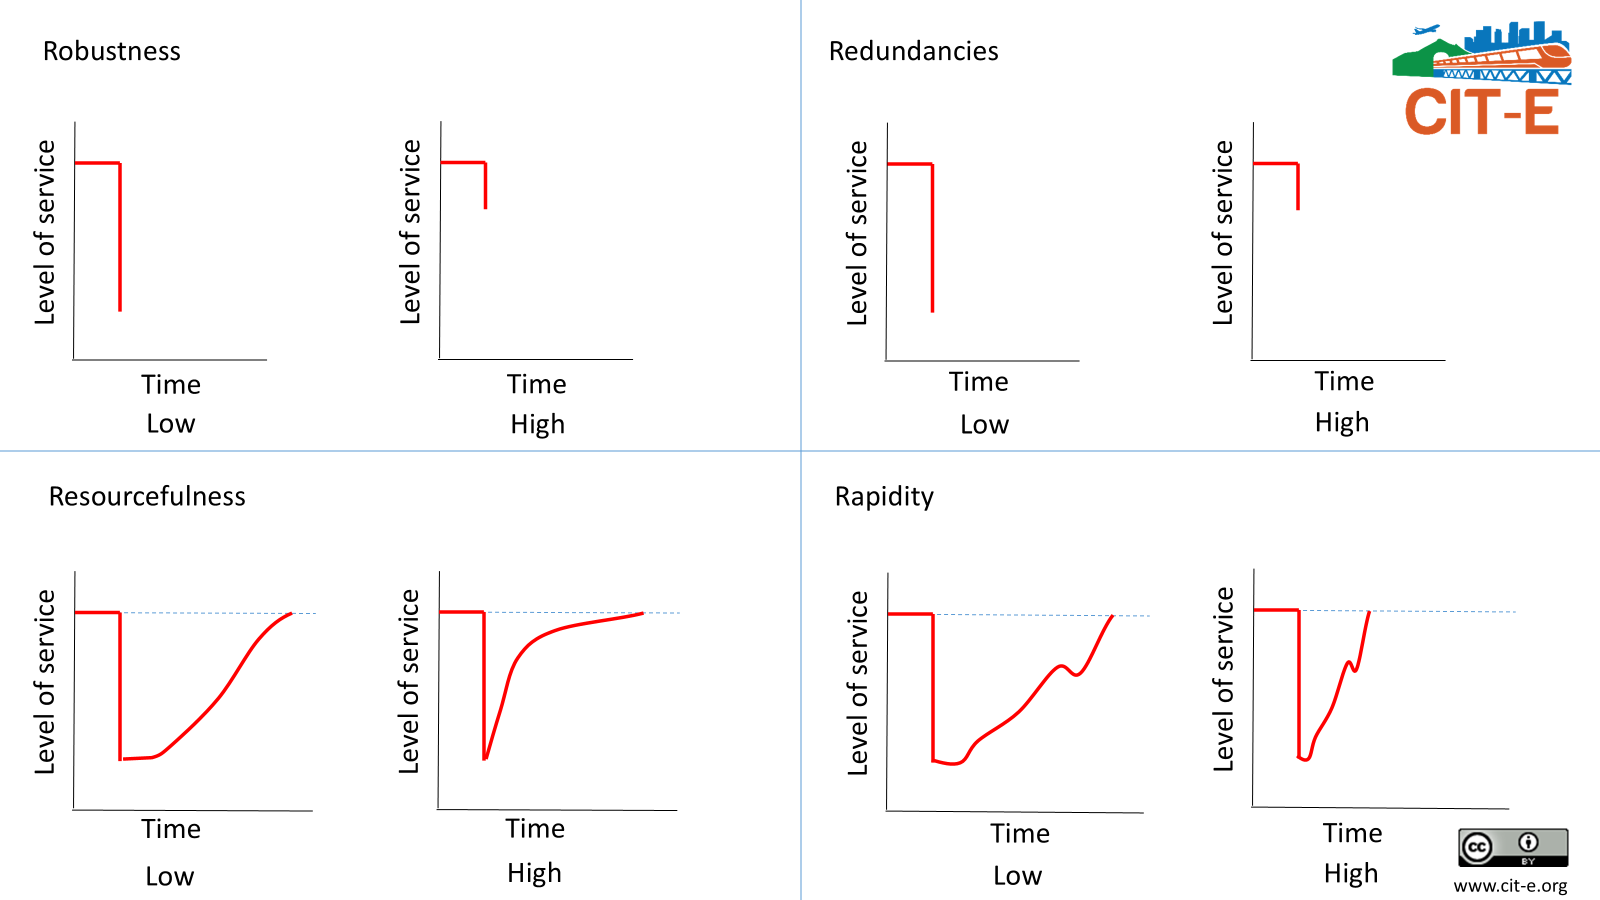
One way to visualize resilience is using a resilience curve. An example resilience curve is shown in Figure 1.5. The resilience curve shows the level of service. The level of service is the quality of the services that infrastructure provides.
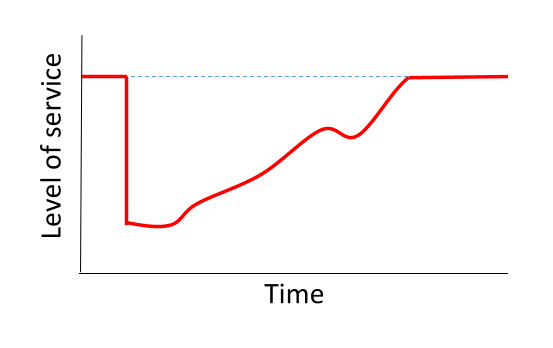
The resilience curve is defined as:
A resilience curve is a plot of a systems function over time. It starts at a certain level of service. When a disruption occurs, the level of service drops. The amount the level of service drops is dependent on the robustness and the redundancy of the system. Over time, the system should start to recover some of the functionality. The shape of the curve indicates the resourcefulness, and the length of time indicates the rapidity (Penn and Boston 2020).
Figure 1.6 shows the impact of the 4 R’s on resilience curves. The robusness and redunancy impact the initial drop in the level of service. The slope or the return to service is impacted by the rapidity and the resourcefulness. A resourceful system will begin to recover more quickly, and a rapid system will have a higher rate of improvement.
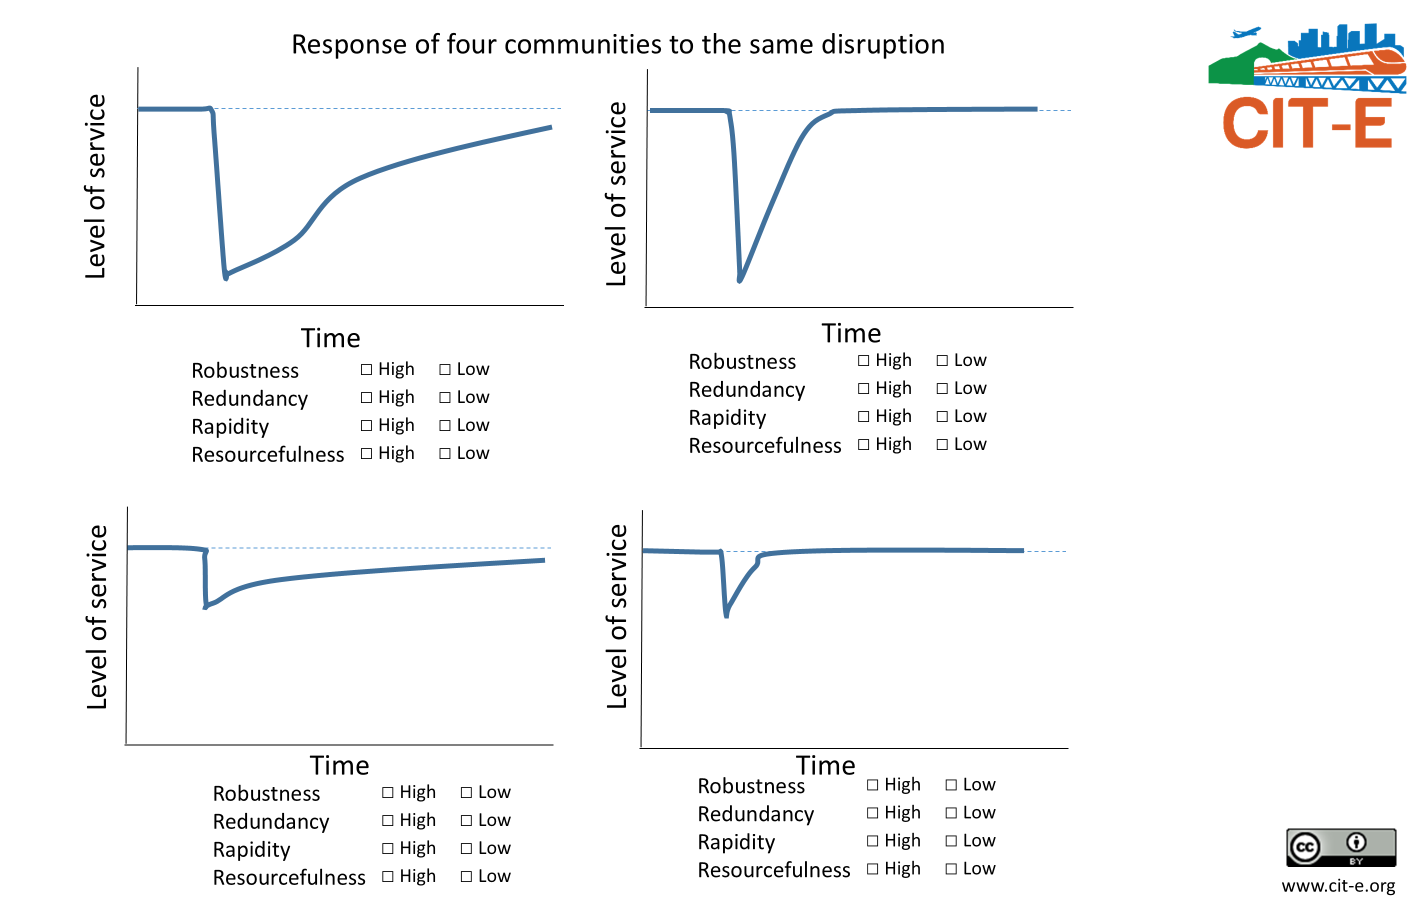
Resilience Rating
Rate the resilience of four different communities exposed to the same disruption in Figure 1.7
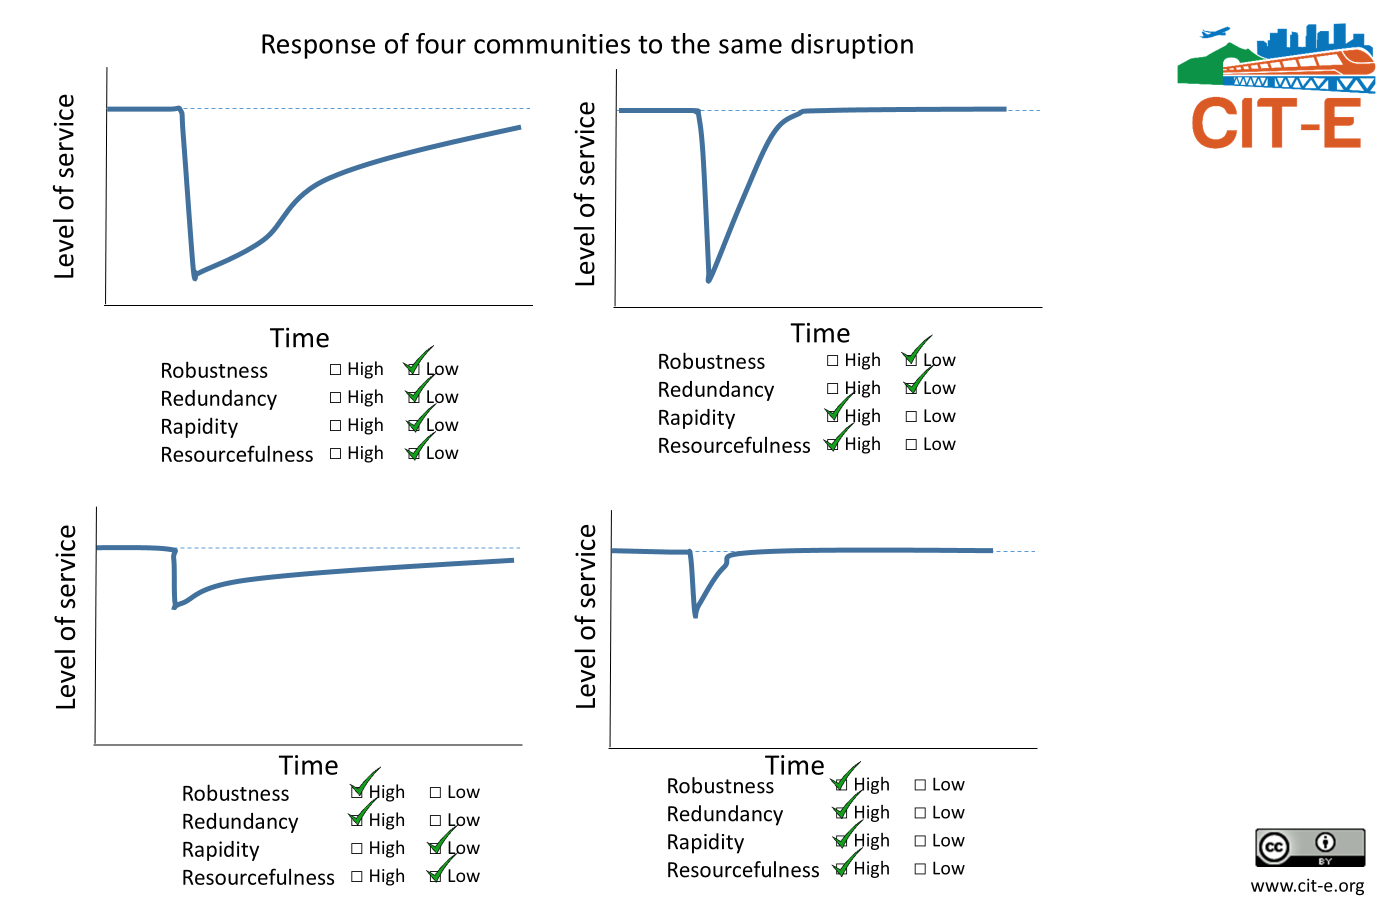
The answer is shown in Figure 1.8. For the community on the top left, all four elements of resilience are comparatively low. The robustness and redundancy was low, as the system lost much of its level of service. It also took a long time to begin to recover from the disruption, implying that its resourcefulness was low. The rate of improvement was also low, implying low rapidity.
The systems in the two bottom charts were more robust or redundant, as less level of service was lost. The bottom-left system took longer to recover, indicating less resourcefulness, less rapidity, or both. The fact that some improvement began immediately could be taken as an indication that some resources were available, so marking only rapidity as low could be acceptable.
1.3 Sustainability
Learning Outcomes
- Define the term sustainability.
- List and explain the elements of the triple bottom line.
- Explain the role of social responsibility and environmental justice in the built environment
When was the last time you spun a top? For how long did it spin? Eventually, even the most well-calibrated tops spinning on the smoothest possible surfaces will topple as the combined forces of gravity, air resistance, and friction overwhelm the angular momentum of the top. Because the top cannot spin forever, this system is unsustainable.

A top is not a very consequential system. But other systems, including the economy and the various systems that compose public infrastructure, have a lot riding on them. It is not hyperbole to say that when these systems fall apart, large numbers of people suffer poverty and death. Keeping these systems going indefinitely needs to be the goal.
In 1987, the United Nations Brundtland Commission (WCED 1987) defined sustainability as:
meet[ing] the needs of the present without compromising the ability of future generations to meet their own needs.
How do we define our needs from the built-environment? How do we balance the needs of the present with future generations? To do so, we will evaluate sustainability using three factors as discussed in the next section.
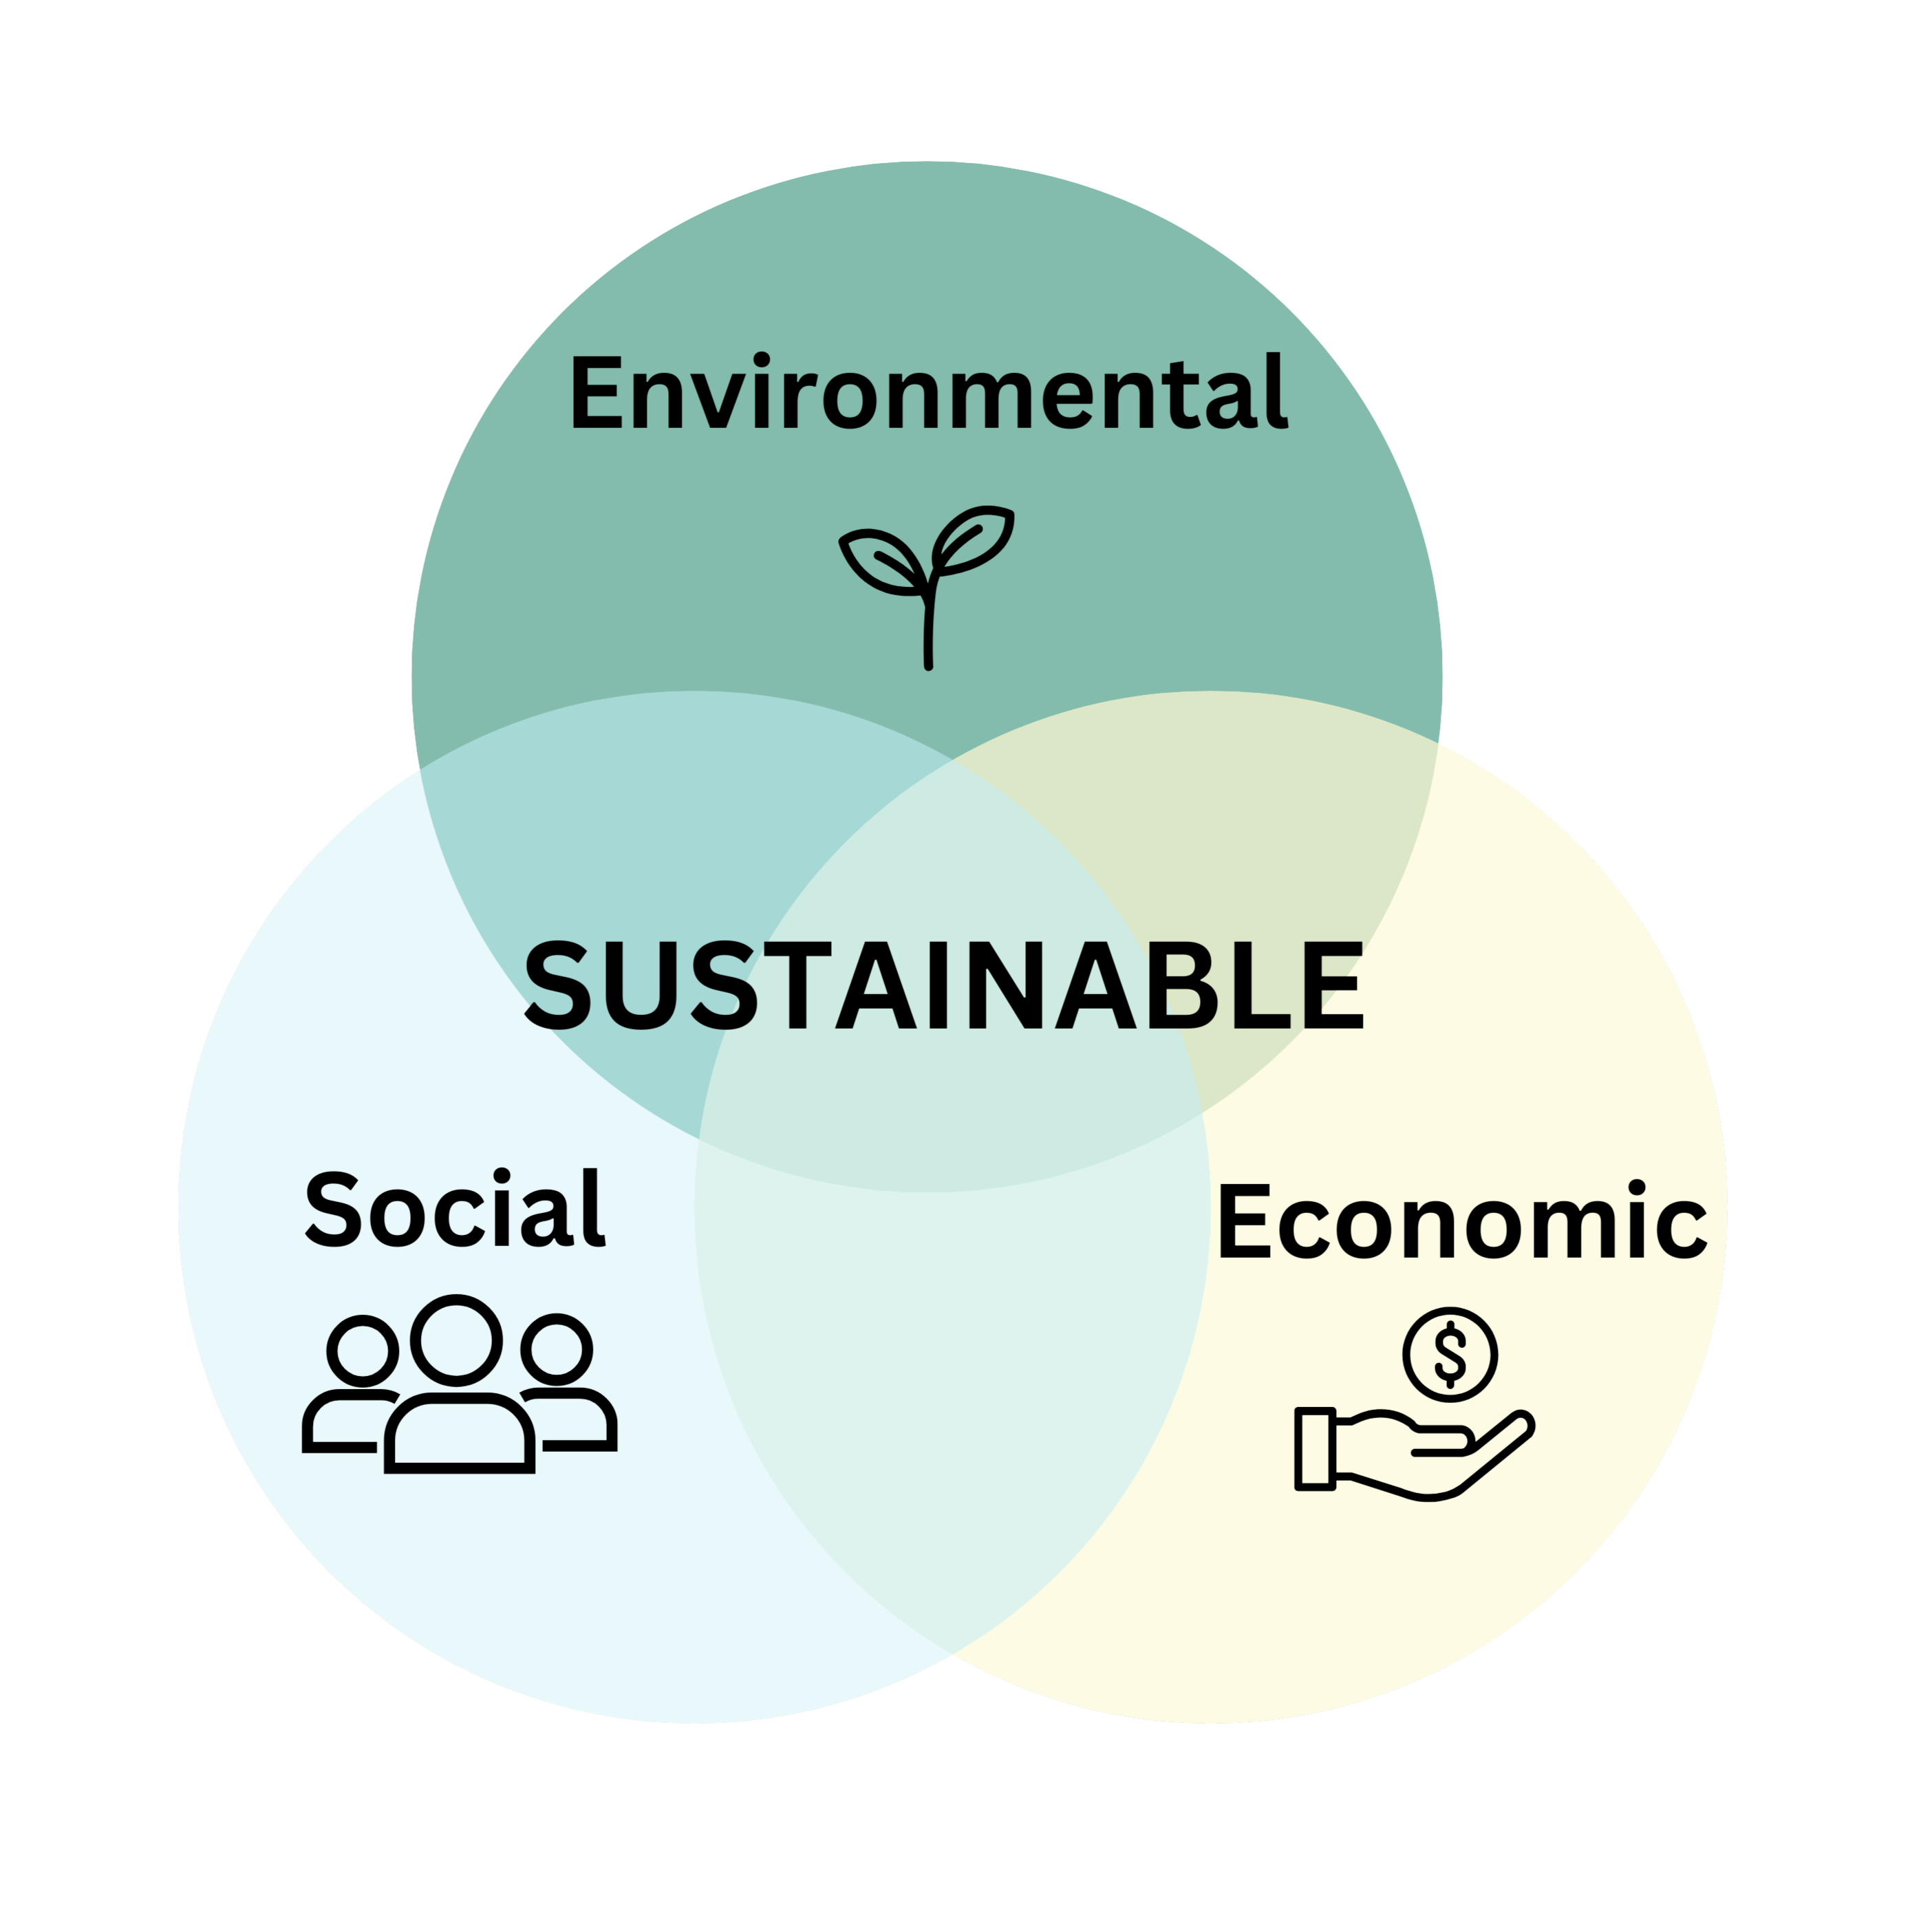
There are three main dimensions of sustainability, sometimes called the triple bottom line, shown in Figure 1.10. These dimensions are:
- Economic
- Environmental
- Social
All three dimensions of sustainability must be handled, or the system will eventually collapse: If a system is economically sustainable but exerts an unacceptable social or environmental toll, then the system is unsustainable. For the build-environment to be sustainable, it needs to fit in the area where all three circles converge in Figure 1.10.
1.3.1 Economic
As mentioned in Section 1.2, the built-environment can provide substantial economic benefits. However, infrastructure is expensive. Like any investment, we need to evaluate if we have the funds to build it, and if the benefits outweight the costs.
Good questions to ask about economic sustainability of a building project are:
- Is the project affordable?
- Does the project return more value than it costs to build and operate?
- Will the project put a financial burden on future generations?
- How will the project be funded?
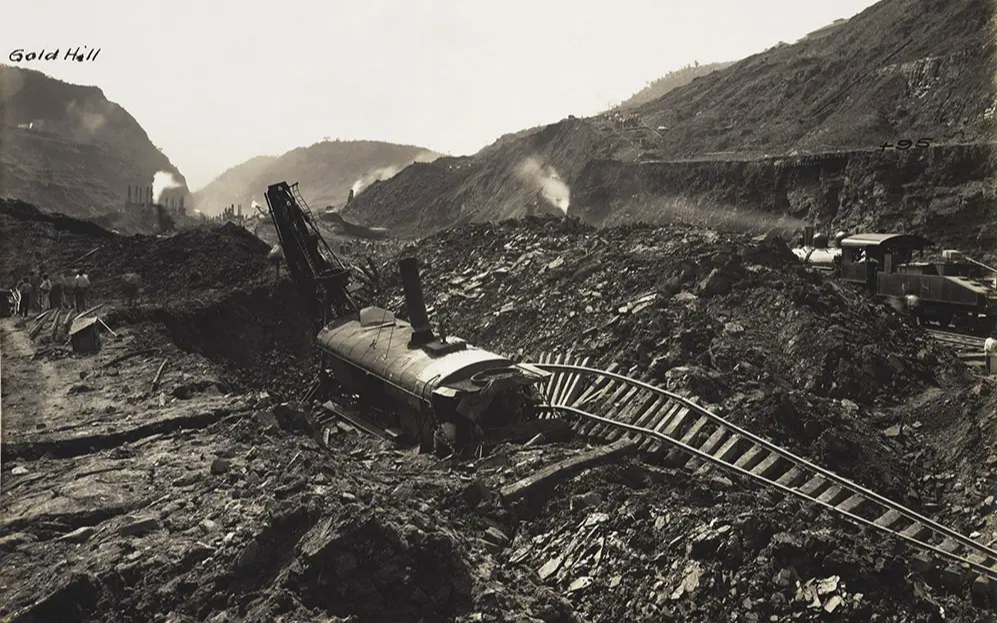
One of the challenges of economic sustainability is estimating the costs of infrastructure. Engineers and builders have historically grossly underestimated the costs of large infrastructure projects.
How much did the Panama Canal Cost?
The Panama Canal, was originally estimated by the French engineer Ferdinand de Lesseps to cost $132 million and 12 years to build (American Experience 1996). The French abondened the effort when they ran out of money and realized it would cost much more. The United States then took over the effort, estimating that it would cost $144 million and 10 years to complete the canal. The United States spend over $379 million and 16 years before it was finally open for civilian traffic. Accounting for inflation, the US spent 2 times their initial estimate to build the canal (Gilbert 2010). Even with the higher actual cost, the US was willing to pay the final cost to get it completed.
Even more difficult than estimating the costs is to estimate the economic benefits a project will produce. In the end, how much is building project worth? As we will discuss in the Chapter 3, the answer is: What society is willing to pay for it. Society determines which projects are worth doing (anticipated value > anticipated cost), and figure out who and how it will be paid.
Infrastructure can provide enormous benefits, but it is difficult for private industry to recoup their investment costs. Thus, it typically falls to governments to fund or subsidize the construction and maintenance of infrastructure. In the US, most large infrastructure projects, such as the Panama Canal, the Interstate Highway System, and the Hoover Dam were all funded by the federal government.
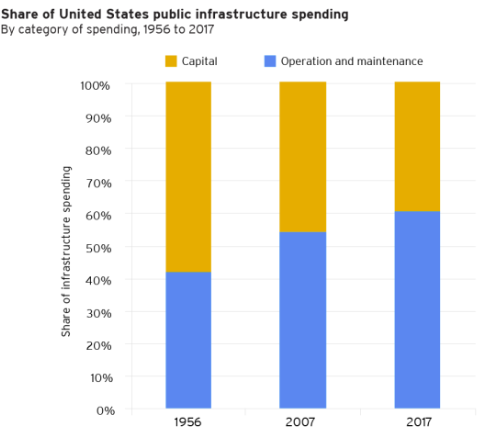
Another challenge of funding infrastructure are the costs to maintain our existing infrastructure. Figure 1.12 shows that most of the funds devoted to our public infrastructure are now used to maintain infrastructure, rather than to construct new infrastruture. Thus for sustainable infrastructure we need to have a plan and the means to fund infrastructure for its lifetime.
Because economics drives the decision to build and maintain infrastructure we will spend more time in Chapter 3 and Chapter 4 introducing tools and concepts to evaluate the financial viability of building and infrastructure projects.
Think
Look up an example of an infrastructure project that cost much more than the projected costs in a region of the world that is meaningful to you. What factors led to the disconnect?
1.3.2 Environmental
Environmental sustainability is a value consistent with our stewardship for God’s creations as discussed in Section 1.1.
The US Environmental Protection Agency defines sustainability in terms of our relationship with the natural environment.
Everything that we need for our survival and well-being depends, either directly or indirectly, on our natural environment. To pursue sustainability is to create and maintain the conditions under which humans and nature can exist in productive harmony to support present and future generations.(EPA 2014)
Good questions to ask regarding environmental sustainability of a building project includes:
- Does the project enhance or degrade the environment?
- Does the project use resources in a way that can be sustained indefinitely?
- Does the project pollute or harm the environment in a way that cannot be mitigated? (Copilot 2023)
1.4 Sustainable Development Goals
Learning Outcomes
- Discuss United Nations Sustainable Development Goals in the context of built environments.
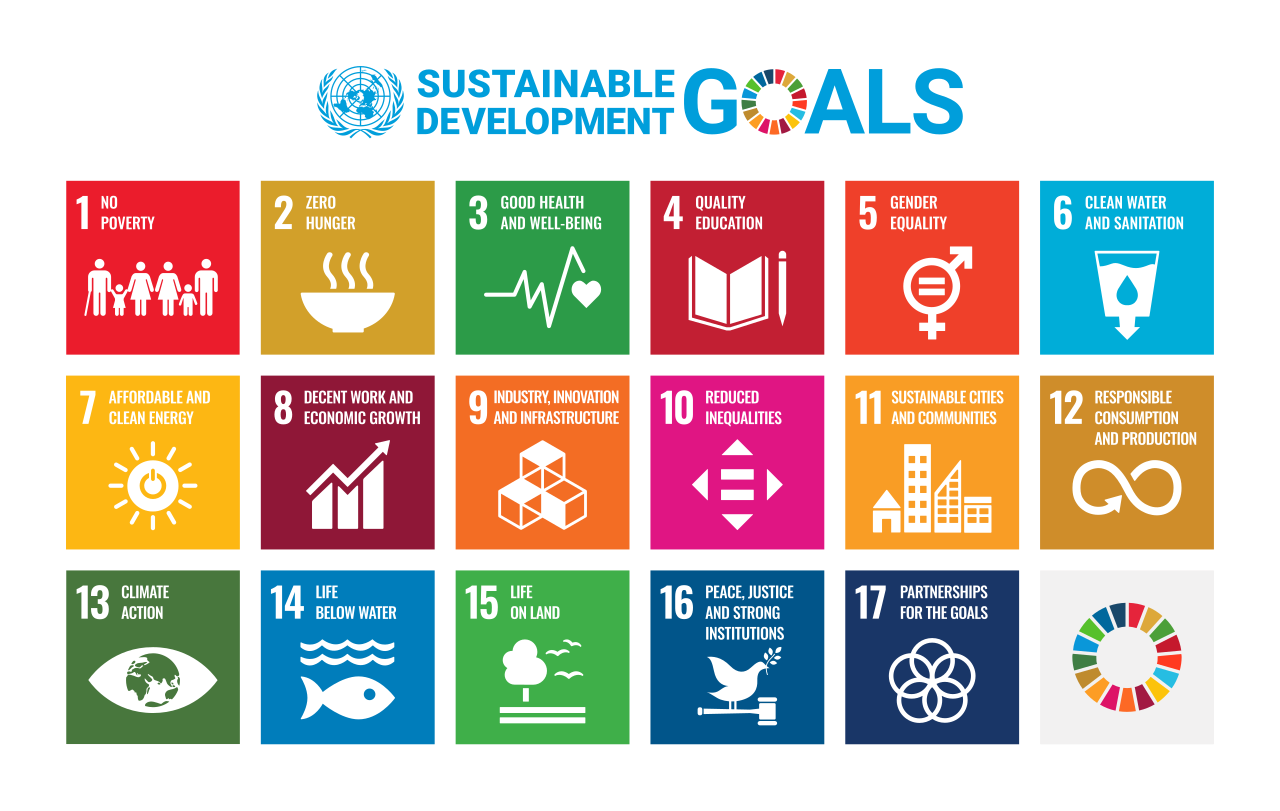
Building homes and infrastructure is one aspect of development, among others such providing access to medical care and education. In 2015, the United Nations member states agreed to a set of 17 Sustainable Development Goals (SDG’s). From the UN SDG website,
The 2030 Agenda for Sustainable Development, adopted by all United Nations Member States in 2015, provides a shared blueprint for peace and prosperity for people and the planet, now and into the future. At its heart are the 17 Sustainable Development Goals (SDGs), which are an urgent call for action by all countries - developed and developing - in a global partnership. They recognize that ending poverty and other deprivations must go hand-in-hand with strategies that improve health and education, reduce inequality, and spur economic growth – all while tackling climate change and working to preserve our oceans and forests.
The 17 goals are shown in a graphic in Figure 1.17. Each of these goals are either directly or indirectly related to the built environment. These goals are ambitious, and are based in a comprehensive understanding of the triple bottom line of sustainability.
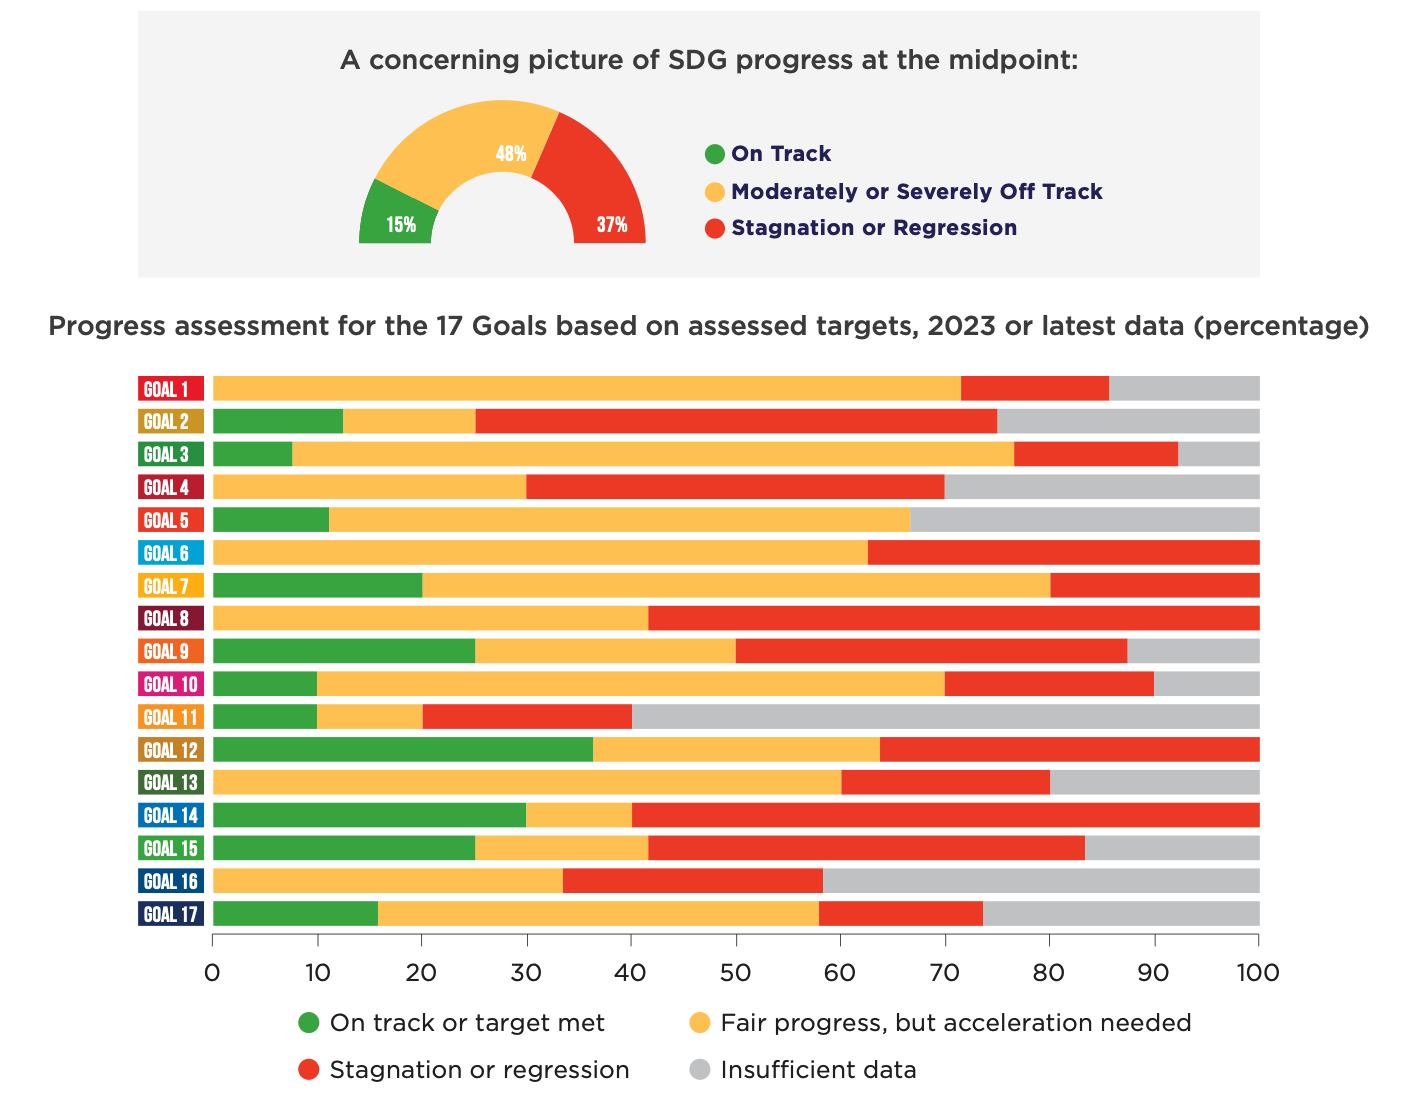
A major element of the SDG’s is not necessarily in achieving the goal, but in helping nations and other organizations build capacity to track their progress and help achieve them in the future. To this end, the goals are associated with targets and paired indicators that can be measured. For example, SDG 11 is “Make cities and human settlements inclusive, safe, resilient and sustainable”, a rather amorphous goal. But this is broken into more manageable targets, such as 11.1: “By 2030, ensure access for all to adequate, safe and affordable housing and basic services and upgrade slums.” Progress towards this target is measured as the proportion of the urban (non-rural) population living in slums. Slums are then defined as housing situations with overcrowding, lacking water or sanitation, or without contract tenure. An interactive graphic of data from this program is given in Figure 1.18. In general, most countries have made progress on the proportion of their population living in slums, but many countries — especially in South Asia and Africa — still see an increase in the number of people living in slums.
The hope is by tracking the indicator, cities and countries can begin to make plans to address the indicator and thereby start to meet the UN SDG’s. The data at the midway point of the 2015-2030 period is sobering: The UN estimates that we are on track to achieve only 15% percent of the measurable indicators by 2030, as illustrated in Figure 1.19.
1.5 Climate Change Science and Impacts
Learning Outcomes
- Describe the role of greenhouse gases in climate change.
- Describe impacts of climate change on built environments.
Climate change describes the long-term fluctuations in temperature, precipitation, wind, and all other aspects of Earth’s climate. Kibert (2016) suggests
The main cause of climate change is the dramatically increasing emissions of carbon gasses, mainly carbon dioxide (CO2), into the atmosphere from fossil fuel combustion by power plants, transportation, building energy systems, cement production, and agriculture. At the same time, Earth is losing its ability to stabilize CO2 concentrations because biomass, such as forests, which absorb CO2 are being lost to land development, deforestation, and mining. The combination of rapidly increasing emissions and decreasing absorption capacity is accelerating the atmospheric concentrations of CO2. Climate change gasses like CO2 trap solar energy, and as their atmospheric concentrations rise, average global atmospheric temperatures also increase. The likely results will be rapidly rising sea levels, substantially reduced crop yields, drought, and more energetic hurricanes and cyclones.
The world is getting warmer, and is doing so at an accelerating rate. This is shown in multiple datasets collected by scientis using different methods. The data shown in Figure 1.20 comes from a scientific estimate of the average temperature at the Earth’s surface over the last 140 years. While overall temperature growth is increasing the temperature change across the globe is not uniform across regions or seasons.
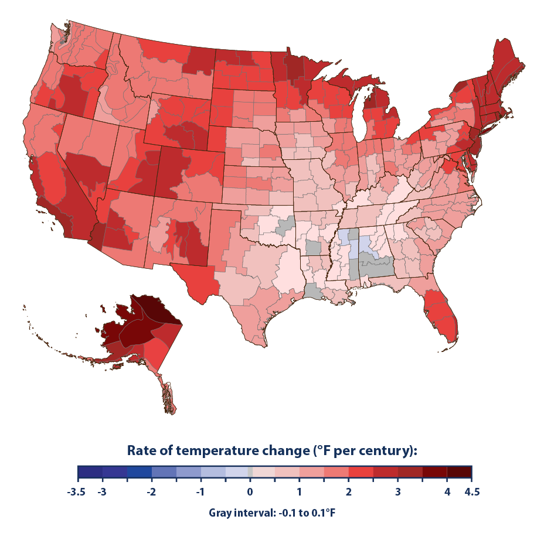
Polar regions have seen the largest increases in average temperatures. Most regions in the US have experienced an increase in 1 to 3 \(^\circ\)F in the last 100 years as shown in Figure 1.21.
Since the Industrial Revolution in the early 19th Century, humans have made great use of the energy contained in fossil fuels such as coal and oil. This energy has helped us build modern economies and enjoy great wealth. But there is a challenge with using fossil fuels. One of the many hydrocarbon molecules in gasoline is octane, \(C_8 H_{18}\). When octane or other carbon-based fuel combusts, the carbon atoms combines with oxygen, and the molecules are rearranged into carbon dioxide and water vapor, releasing substantially more energy than was used to initiate the reaction, as shown below: \[C_8H_{18} + 12.5 O_2 \rightarrow 8 CO_2 + 9 H_2O\] Because the carbon in the octane combines with oxygen, one U.S. gallon (3.8 L) of gasoline produces 19.3 lb (8.74 kilograms) of carbon dioxide (or 2.3 kg/L) when it burns. So, the mass of carbon dioxide gas ends up being greater than the mass of the fuel entering the engine. Continued use of carbon-based fuels has led to a substantial increase in the concentration of carbon dioxide in Earth’s atmosphere, as shown in Figure 1.22. In this chart, the red line represents monthly average observations and the black line is a moving average trend line.
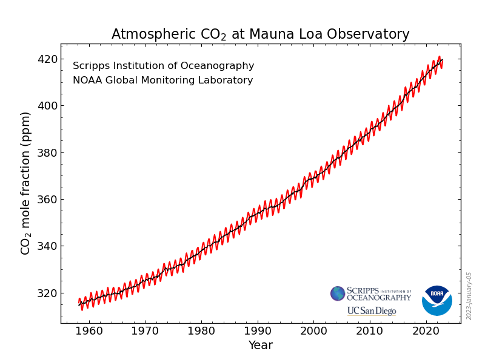
Figure 1.23 shows the correlation between atmospheric carbon dioxide and global mean surface temperatures for the last 120 years. Of course, correlation and causation are not the same thing. But there is a strong explanatory relationship that lends causal support for the idea that the Earth is getting warmer because of the increased carbon dioxide.
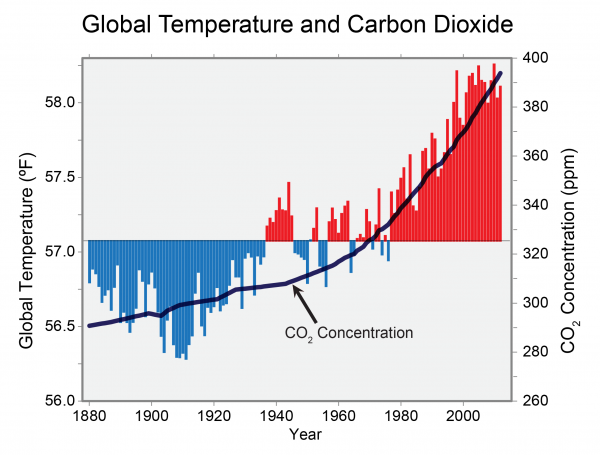
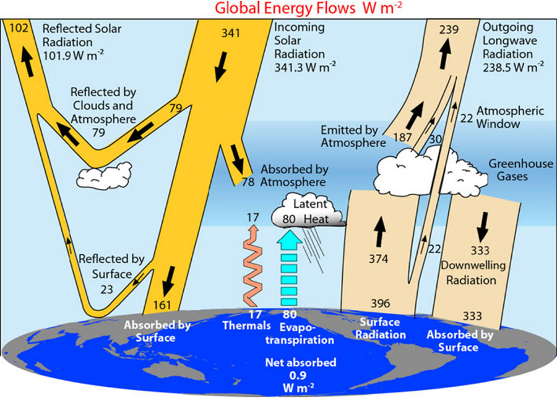
Figure 1.24 illustrates the spectrum of radiation emitted from the sun. The most abundant radiation of light has short wavelengths with the range of visible light. Thus, our eyes are created to see visible light at the wavelengths that are also produced most abundantly by our sun. You could say that we are designed for this earth and the sun was designed for us. In addition to providing light, most of the sunlight penetrates the atmosphere heats up the oceans and the surface of the earth as shown in Figure 1.25.
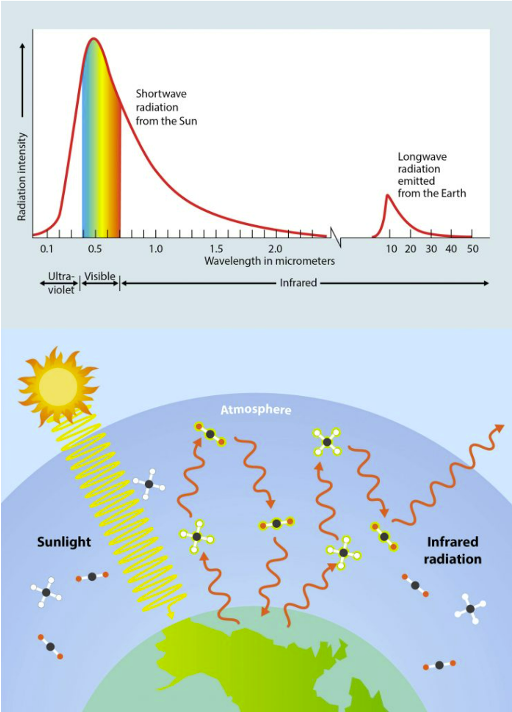
The earth also emits radiation, but because the earth is much cooler than the sun, it produces infrared radiation which is outside the spectrum of visible light. The greenhouse gases in our atmosphere, including water vapor, methane, and carbon dioxide captures much of the infrared radiation emitted from the earth, which is then radiated back to earth as downswelling radiation shown in Figure 1.24 and Figure 1.25. In this way, the earth’s atmosphere acts like a blanket that keeps the earth warm enough to sustain life. By increasing the amount of greenhouse gases in the atmosphere, we are essentially increasing the thickness of the blanket around the earth. This is causing the temperature on earth to increase.
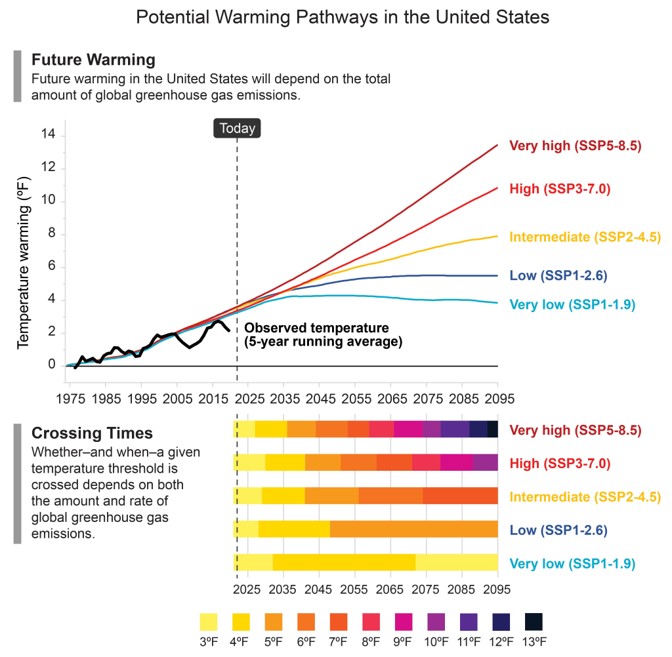
How warm will earth get? That depends on future emissions of carbon dioxide and other greenhouse gas emissions. Climate scientists working together on the Fifth National Climate Assessment have evaluated potential future pathways of global carbon emissions 2 in Figure 1.26.
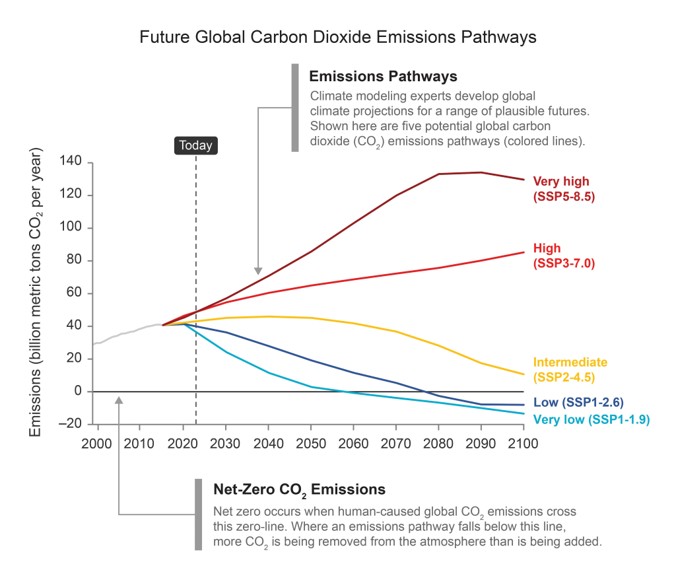
If emissions are sharply reduced in the future, the Fifth National Climate Assessment estimates we could limit global warming to 4\(^\circ\)F, but if we continue to increase \(CO_2\) emissions we could see the earth warm by over 13\(^\circ\)F by the end of the century.
1.5.1 Climate Change Impacts on the Built Environment
Why is climate change important for the built-environment? Our buildings routinely heat or cool the outside air by many degrees Farenheiht (\(^\circ\)F). What’s the big deal with an increase of 1 to 3 \(^\circ\)F to the annual average temperature?
By increasing the temperature across the earth, the climate of earth is also changing. This is increasing the frequency and severity of extreme weather events that pose a risk to the built-environment. Existing infrastructure has been built to withstand historical observed weather events. However, we may not longer be able to rely on historical records to accurately predict the frequency or intensity of future extremet weather events.
The Fifth National Climate Assessment has determined the climate change has caused the following impacts in the US with high to very high confidence:
- Heatwaves have become more common and severe in the West
- Drought risk has been increasing in the Southwest over the past century
- Rainfall has become more extreme in recent decades, especially east of the Rockies
- Hurricanes hae been intensifying more rapidly since the 1980’s and causing heavier rainfall and higher storm surges
- More frequent and larger wildfires have been buring in the West in the past few decades due to a combination of climate factors, societal changes, and policies. (USGCRP 2023)
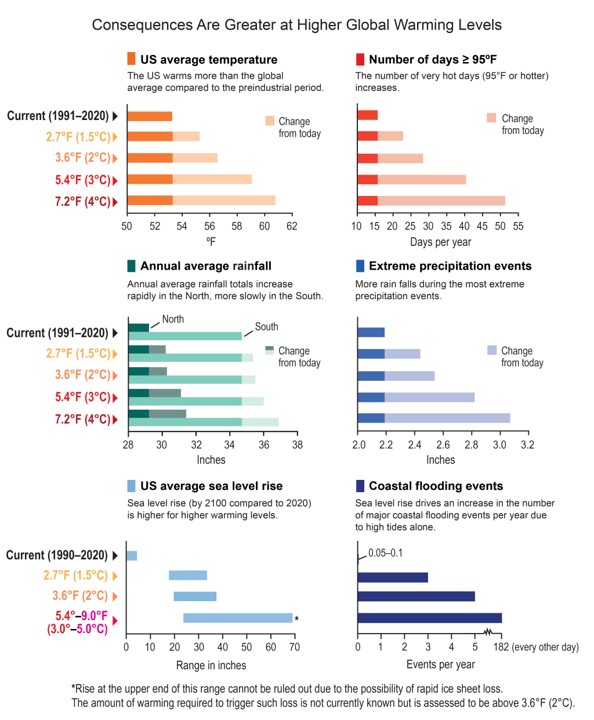
The negative impacts of climate changes are predicted to increase in the future. These impacts include increased humber of heatwaves, increase in extreme precipitation events, sea-level rise, and number of coastal flooding events (See Figure 1.28). These impacts can also lead to other negative impacts including:
- Scarcity of reliable and clean water. Flooding and droughts, coupled with sea level rise pose a threat to reliable water supplies.
- Damage to homes and infrastructure from wildfires,flooding from extreme events, and sea-level rise.
- Landslides from heavy-rain fall and wildfires can damage roads, bridges, and other infrastructure (USGCRP 2023).
The magnitude and speed of the climate impacts will depends on the level of greenhouse gases in the atmosphere, as well as our efforts to adapt to climate change.
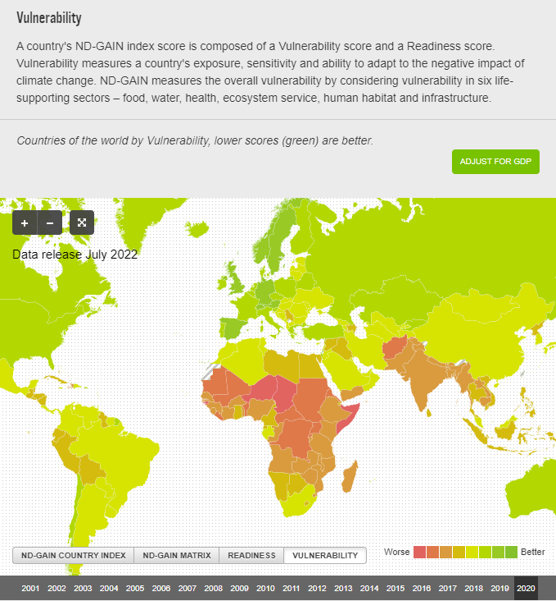
Another important aspect of climate change impacts, is that the impacts are not borne equally. The Fifth National Climate Assessment report points out the that lower income and minority communities are more vulnerable to floods and other impacts from climate change. (USGCRP 2023). Developing countries, such as those in Central Africa, are more vulnerable to the impacts of climate change than industrialized nations (see Figure 1.29). In contrast, developing countries have contributed substantially less to global greenhouse gas emissions than more industrialized nations, but still bear a disportionate share of the impacts.
1.6 Climate Change Adaptation and Mitigation
Learning Outcomes
- Classify built environment proposals as adaptation or mitigation with regards to climate change.
- Understand the difference between operational, embodied, and transportation carbon emissions 3
- Understand the stages of a life-cycle GHG emissions analysis
Climate change is interrelated with the sustainability of infrastructure systems in two distinct ways: mitigation and adaptation.
1.6.1 Mitigation
The goal of climate change mitigation is to “reduce the amount and speed of climate change.(USGCRP 2018).” There are a few basic strategies to do this:
- Reduce the amount of carbon dioxide and other greenhouse gases emitted by human activities.
- Increase the earth’s capacity to absorb carbon dioxide, such as increasing the total volume of vegetation.
- Reduce the amount of solar energy absorbed by earth’s surface to offset the greenhouse effect.
Major sources of carbon emissions from the built-environment include operational, embodied, and transportation carbon emissions. (Baker 2023)
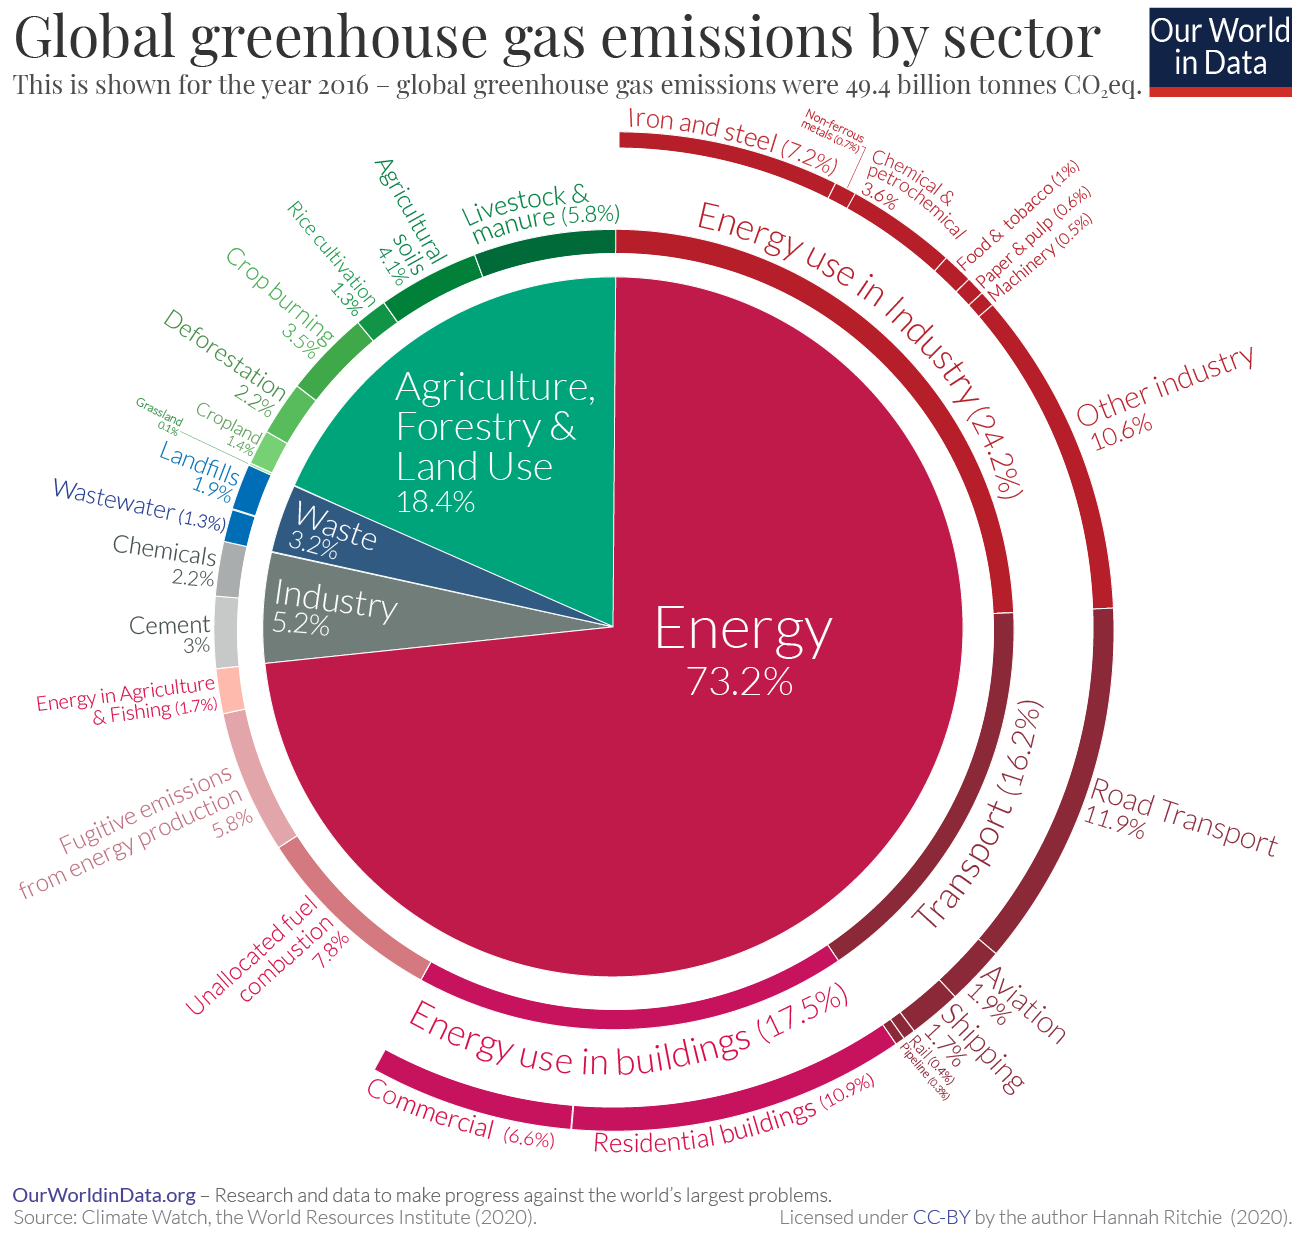
Operational carbon emissions refer to the emissions used in the operation of a building, including heating, cooling, lighting, and electricity. As shown in Figure 1.30, operational carbon emissions world-wide contribute around 18% of total greenhouse gas emissions.
Embodied carbon emissions refer to the greenhouse gas emissions used in constructing the building. This includes the emissions produced from the materials used to build, renovate or maintaing a building. For example, refining portland cement emits large amounts of \(CO_2\) through the chemical process of creating the cement from calcium carbonate or limestone \(CaCO_{3}\). One of the reactions that occurs when producing cement is shown with calcium carbonate is shown below (Fayomi et al. 2019): \[CaCO_{3} + heat \rightarrow CaO + CO_2\] Concrete is estimated to contribute to 7-8% of global greenhouse gases (USGS 2024). In Figure 1.30, the contribution of concrete is split between industry use (accounting for \(CO_2\) produced from the chemical reactions as shown above) and energy use in industry (accounting for the \(CO_2\) produced from burning fossil fuel for the refinery ovens). Other construction materials are significant global contributors to greenhouse gases, including steel and iron. Also, materials like aluminum have very high embodied energy if refined from bauxite, but are easily recycled.
Sustainable materials and products have low levels of embodied carbon emisisons. A material that is locally sourced and is relatively un-processed will have a low level of embodied carbon emissions. For example, raw and engineered timber that has been sustainably harvested and processed removes carbon from the atmosphere (as a tree) and then stores the carbon in the timber used in the building. One challenge in using sustainable materials is lower or more varied strength compared to traditional building materials. Selection for a building is complex and requires careful consideration to find and use materials which deliver on all aspects of sustainability.
Embodied carbon emissions also include emissions produced from the construction of the building, including from construction equipment and transportation of materials to the construction site (USDOE 2024).
Transportation carbon emissions refer to the emissions used for transportation not used in the construction of the building. Transportation is not directly emitted from building or infrastructure, but the way we build and place our buildings and infrastructure has a large impact on transportation emissions. Globably, transportation produces 16.2% of total GHG emissions, primarily through the burning of fossil fuels.
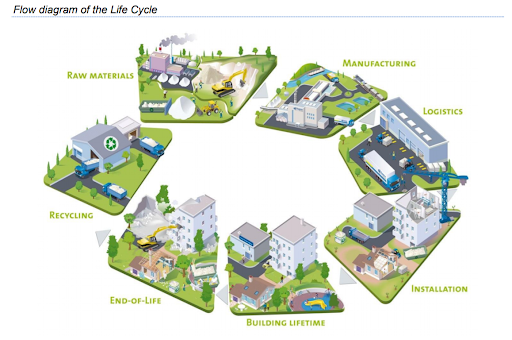
When evaluating the emissions from a building, it is important to consider the emissions from all processes and stages of the building. One of the most important techniques to evalute greenhouse gas emission contributions is to conduct a life cycle analysis of the carbon emissions from a project. This must consider not just the emissions used in constructing a project, the embodied carbon of the materials used, as well as the emissions from repurposing, rebuilding, or demolishing and recycling a project (See Figure 1.31). A life cycle analysis might also discover that construction materials that are renewable or energy-saving could deliver long-term economic savings
Other ideas abound. Buildings can be designed in ways that limit heat absorption in the summer and maximize it in the winters, lowering energy expenditures. Neighborhoods and cities can be laid out in ways that maximize the usefulness of walking and public transit, or that minimize water consumption while remaining pleasant and green.
1.6.2 Adaptation
The goal of climate change adaptation is to be build infrastructure that is resilient to the changing climate. We are past the point where the deleterious effects of climate change can be avoided. Engineers need to understand how climate change might affect their current practices, and how these practices might need to adapt. For example, a coastal structure might need to withstand elevated or more powerful tides resulting from rising sea levels. What used to be a 100-year storm could become 50- or 20-year storm, meaning that culverts and drainage systems need to be engineered for a considerably larger storm surge. Existing culverts and drainage systems might need to be prioritized for replacement.
How well are we adapting to climate change in the US?
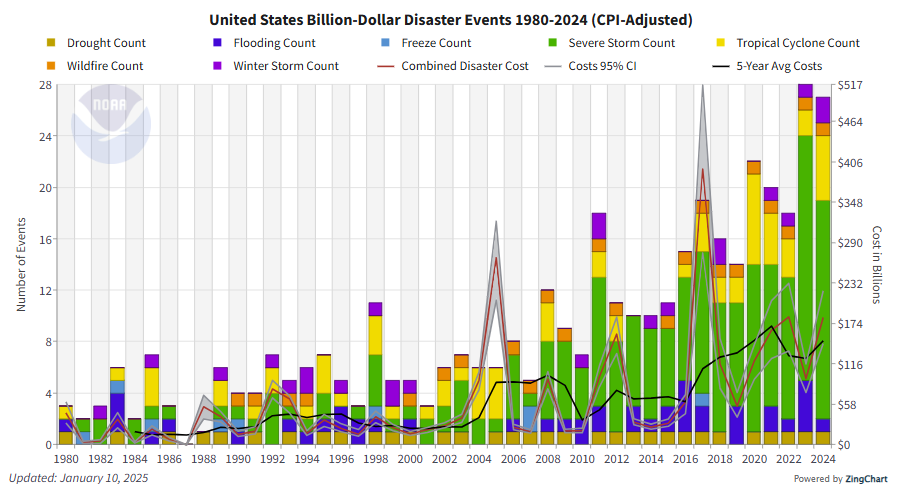
Figure 1.32 shows the number of weather and climate disasters that caused more than 1-billion (inflation adjusted) dollars in damage. In the 1980’s the US averaged 1-billion dollar diaster every 4 months. Now we average one every 3-weeks! Climate change is one of many contributing factors in the increase in costly disasters, particularly for increasing the number of disasters caused by droughts, wildfire events, heavy-rainfall events, and hurricane storm-surges (NOAA 2025).
The National Oceanic and Atmospheric Administration (NOAA) reports that the increase in billion dollar weather and climate disasters are a function of increased exposure, vulnerability, and frequency of events.
The number and cost of weather and climate disasters increased over time in the United States due to a combination of increased exposure (i.e., more assets at risk), vulnerability (i.e., how much damage a hazard of given intensity -wind speed, or flood depth, for example - causes at a location), and the fact that changes in the frequency of some types of extremes that lead to billion-dollar disasters (NOAA 2025).
Climate change can increase the frequency of extreme events and may make some communities more vulnterable to disasters (for example, coastal communities). (NOAA 2025): The report point out that there are other important factors that increase exposure and vulnerability that are indepenent of climate change:
For example, the increase in population and material wealth over the last several decades are an important cause for the rising costs. These trends are further complicated by the fact that much of the growth has taken place in vulnerable areas like coasts, the wildland-urban interface, and river floodplains. Vulnerability is especially high where building codes are insufficient for reducing damage from extreme events (NOAA 2025).
Given this context, do you think we are doing well at adapting to climate change? Is the increase in billion-dollar events sustainable? Or given the increased population and wealth of our nation, do you think the increase in disasters is an acceptable outcome that doesn’t need to be addressed?
Think
Dallin H. Oaks said in a General Conference address
There are many political issues, and no party, platform, or individual candidate can satisfy all personal preferences. Each citizen must therefore decide which issues are most important to him or her at any particular time. Then members should seek inspiration on how to exercise their influence according to their individual priorities. This process will not be easy. It may require changing party support or candidate choices, even from election to election.
Climate change policy is a contentious issue in United States politics. The costs of action are high, and the evidence for it can be hidden in the natural variability of the climate. You need to decide for yourself where climate change ranks among the various policy priorities you might have. It might be your most important issue, or it might be an issue that isn’t in your top ten. It is important that members of the Church respect each other’s priorities and political choices.
In this class, you don’t have to consider climate change as your primary political issue. But you do need to understand the science behind it, and the likely impacts of climate change on infrastructure. And, how we can use infrastructure to adapt to climate change or even mitigate it.
1.7 Urbanization and Sprawl
Learning Outcomes
- Describe motivating forces of urbanization and the need for urban infrastructure.
- Discuss characteristics and challenges of predominant development patterns.
Cities are among humanity’s most important inventions; effectively, a city is a tool that allows people to diversify their skills and develop expertise, while efficiently sharing infrastructure and resources. With one family living alone in the wilderness, all of that family’s efforts and skills are focused on survival and basic needs for shelter, food, etc. If families group together, tasks can be distributed based skills and abilities. The overall workload on each person decreases, and collective living standards rise. Repeat this several times, and you begin to have a town, and then a city. This process of people grouping together in cities is called urbanization.
Urbanization has happened throughout human history4, but it has accelerated since the industrial revolution in the 19th century. Figure 1.33 shows the growth of urban populations over the last sixty years in a selection of countries. Western developed nations tend to have urbanization rates over 80%, while the world average passed 50% for the first time in 2010. This average is still rising, driven largely by rapidly increasing urbanization in India, China, and sub-Saharan Africa.
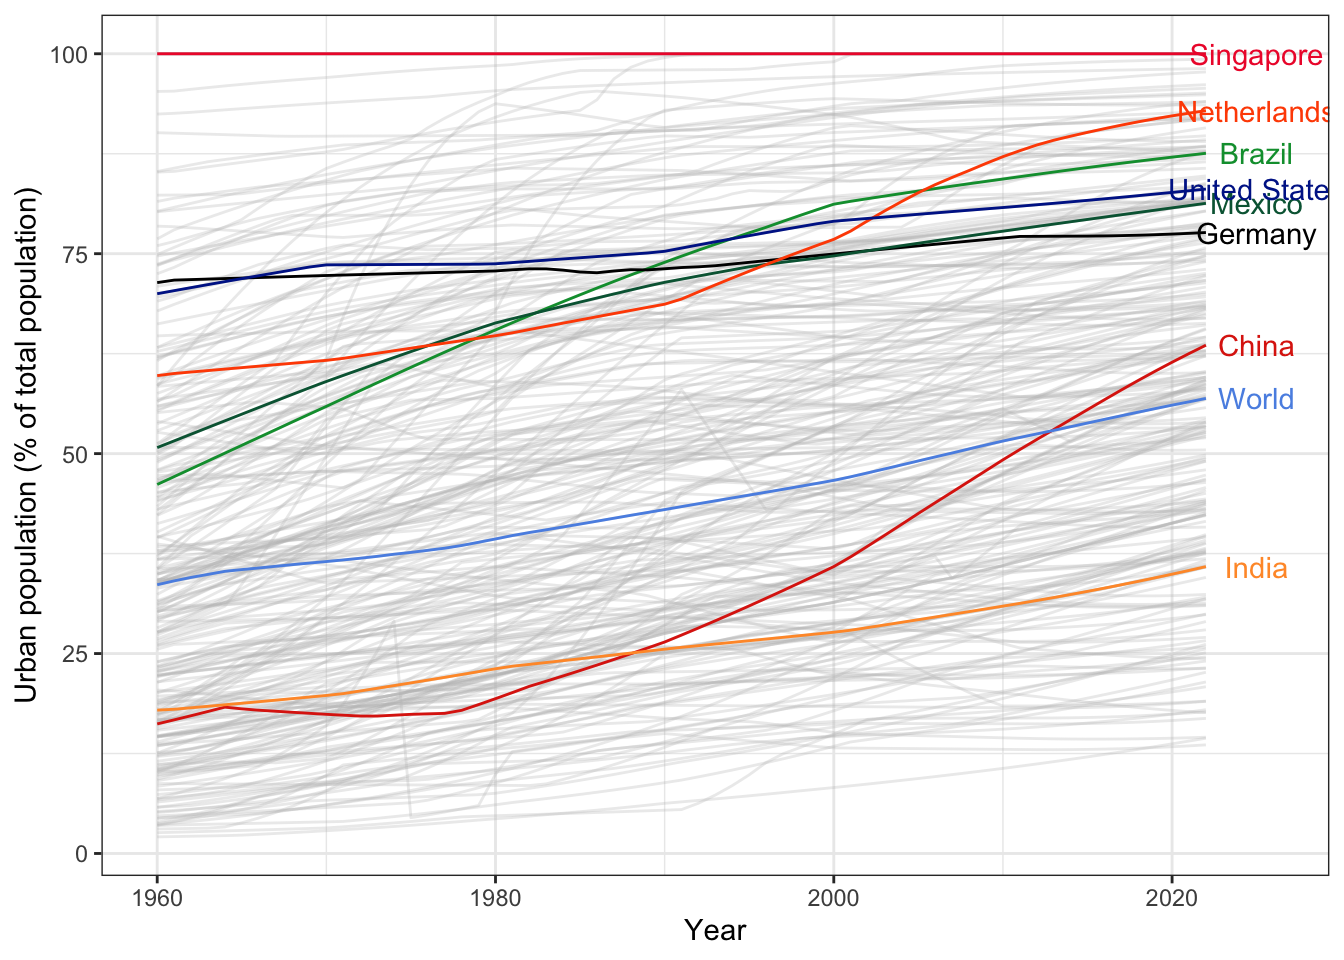
There is obviously an upper limit of 100% urbanization that has has already been reached in places like Singapore and Hong Kong, but even these areas experience immigration and native population growth. Is perpetually increasing urban population growth sustainable? This is an important question, but for the most part we (civil engineers, city planners, etc.) need to take perpetual urban growth as a fact, and build infrastructure that makes this growth sustainable in each dimension of the triple-bottom line.
This is challenging. Per capita use of infrastructure systems — energy, water, transportation, etc.—
in urban areas is substantially lower in urban areas than in rural areas, but the concentration of demand in urban areas requires careful planning and management to avoid straining infrastructure systems.
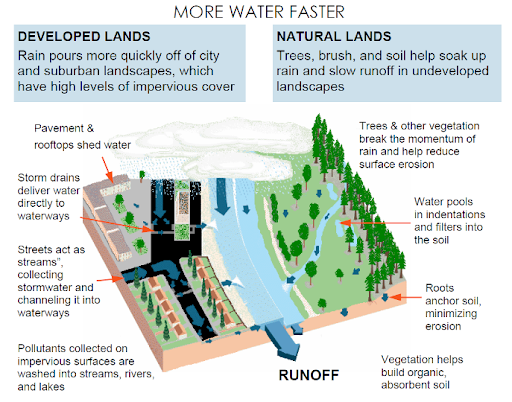
As an example, Figure 1.34 shows how water runs off in urban areas versus on natural land use. Natural land stores lots of water in soil and vegetation, leading to lower peak runoffs and longer delays between rainfall and runoff. Impermeable surfaces like roads and buildings in urban areas instead allow water to run off quickly and easily. Engineers are careful to design retention ponds and other water storage systems to store water up to particular standards, but if the storm is bigger than the standard, a flood happens.
1.7.1 Suburban Sprawl
Many regions — especially in the United States — have experienced a form of quasi-urbanization — literally, sub-urban — where urban population growth agglomerates on the edges of metropolitan areas where land is cheap. The urban areas tend to “sprawl”; distinguishing features of sprawl are sometimes categorized as “four D’s” (Hamidi et al. 2015):
- Low development density in terms of population or jobs per square mile
- Low diversity of land use: residential areas are strongly separated from office and retail areas.
- Low destination centering: heavily sprawled communities often lack a defining central area
- Poor street design: roads designed for high volumes and speeds are unsafe and unpleasant to walk or cycle beside. At the same time, neighborhood streets that try to limit volumes and speeds artificially lengthen walking trips.
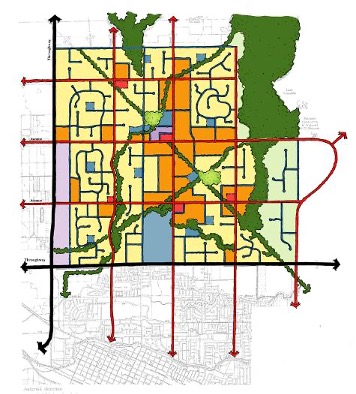
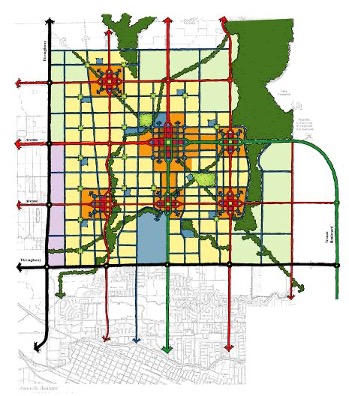
Consider two possible designs for the same town in Figure 1.35. Figure 1.35 (a) shows development typical of the United States in the last fifty years, with large arterial roads lined with shopping centers bracketing subdivisions with few connections between them. Figure 1.35 (b) shows an alternative design, where neighborhood streets continue across the arterial roads and development is focused on a few central cores with dense connected streets. This design is more reminiscent of traditional towns built before the widespread use of automobiles, but there is nothing about this design that prohibits or limits automobile use. The two designs have the same number of people and businesses, but because the traditional design is more compact, there is more land left for agricultural or recreational use. Distances from most homes to most businesses are also shorter, leading to lower energy use in transportation as well as lower costs for building and maintaining roads, water systems, and other infrastructure.
Think
Think of a built space that you are familiar with and have strong positive feelings about. What design elements help to create these positive feelings?
Now think of a built space that brings negative feelings. What design elements help to create these negative feelings?
Finally, think of the neighborhood you grew up in. Was is more like the design in Figure 1.35 (a), or the design in Figure 1.35 (b)? Is that the kind of neighborhood you would want to be in forever if you could change it? Why or why not?
Why has sprawl become the prevailing development pattern in the United States? Surely, its large homes and properties are popular. But this popularity is also aided by tax and zoning policies that incentivize or even require this kind of development, and supported by high private vehicle ownership rates. And as metropolitan regions deal with affordable housing shortages, it is hard to believe that large homes on the outskirts of cities — far away from jobs and opportunities — are a sustainable solution. Compact development is more financially efficient than sprawling development as well (Carruthers and Ulfarsson 2003). Affordable low-density housing, low taxes, and well-maintained infrastructure are in conflict with each other; one will have to be sacrificed to keep the others.
1.8 Regulations in the Built Environment
Learning Outcomes
- Understand the role of government regulations in relation to the built-environment, including building codes and professional licensing laws require buildings and infrastructure meet basic safety, social, and environmental standards.
- Be familiar with the objectives of landmark social and environmental policies and laws in the US relating to the built-environment
- Describe the steps of the environmental review process as part of the National Environmental Policy Act (NEPA).
1.8.1 Building Standards, Codes, and Professional Licensure
In practice, how do we build and maintain infrastructure that is sustainable in all three areas of the triple-bottom line? is to the public has demanded minimum standards through government regulations. One framework using to building codes and standards and professional licensure to assure that buildings and infrastructure meet basic safety, quality, and environmental standards.
Bill Wallace, in his book, The Great Civil Engineering Overhaul, provides a good explanation of building code and standards (Wallace 2024).
To fulfill their roles and responsibilities in planning, designing, and delivering infrastructure projects, civil engineers are obligated to follow the applicable codes and standards developed jointly and adopted by industry, government, and stakeholders. In general, codes are rules and specifications on what is needed to achieve minimum quality, safety, reliability, productivity, and efficiency. They can be approved and made enforceable by local, state, or federal governments. Standards are the “how-to” requirements that establish uniform engineering or technical criteria, methods, processes, and practices to achieve the required level of performance (ASCE 2023). In simple terms, codes tell the engineers what to do. Standards tell the engineers how to do it.
The enforcement of building codes is done through permitting and building inspections. Enforced building-codes save lives. Figure 1.36 shows pictures from two earthquakes that both occured in 2010. The earthquake in Haiti had over 230,000 fatalities and displaced over 1.5 million people. In contrast, the earthquake in Chile, which was over 500 times more powerful, only resoulted in over 521 fatalities. (Adams, Thompson, and Parker 2020)
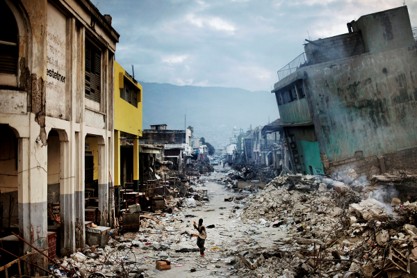
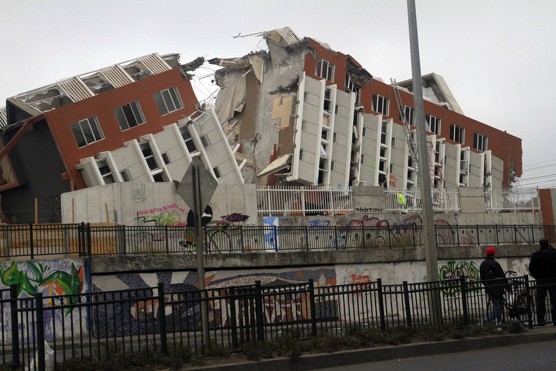
One major difference among many was that Chile had building codes that required seismic loads, and Haiti did not (Adams, Thompson, and Parker 2020). Without building codes, builders can build without proper methods or materials, focus on the cutting short-term costs, but risk suffering large social and economic costs in the future.
While primarily aimed at keeping the public safe, building codes also address environmental areas such as energy-efficiency (e.g. insulation, and efficiency requirements for appliances, and heating, ventilation, and cooling systems), storm-water run-off, and water conservation.
Professional licensure in the built-environment works together with building codes and standards to protect public health and safety, and maintain building quality standards. Since it is not possible for a city building department to oversee and enforce building codes on all projects, the public trusts that licensed building professionals, including Professional Engineers, General Contractors, plumbers, and electricians will follow the building codes to protect public safety and the consumers. Infact, two large infrastructure failures, the failure of the St. Francis Dam near Los Angeles, CA in 1928 which killed over 400 people, and a natural gas leak and explosion in a school in New London, Texas killing 300 people, helped catalyze California, Texas and other states to pass professional engineering and surveying licensing laws (NCEES 2025). We will discuss the ethics and responsibilites of licensed professionals more in Chapter 2.
1.8.2 US Federal Regulations
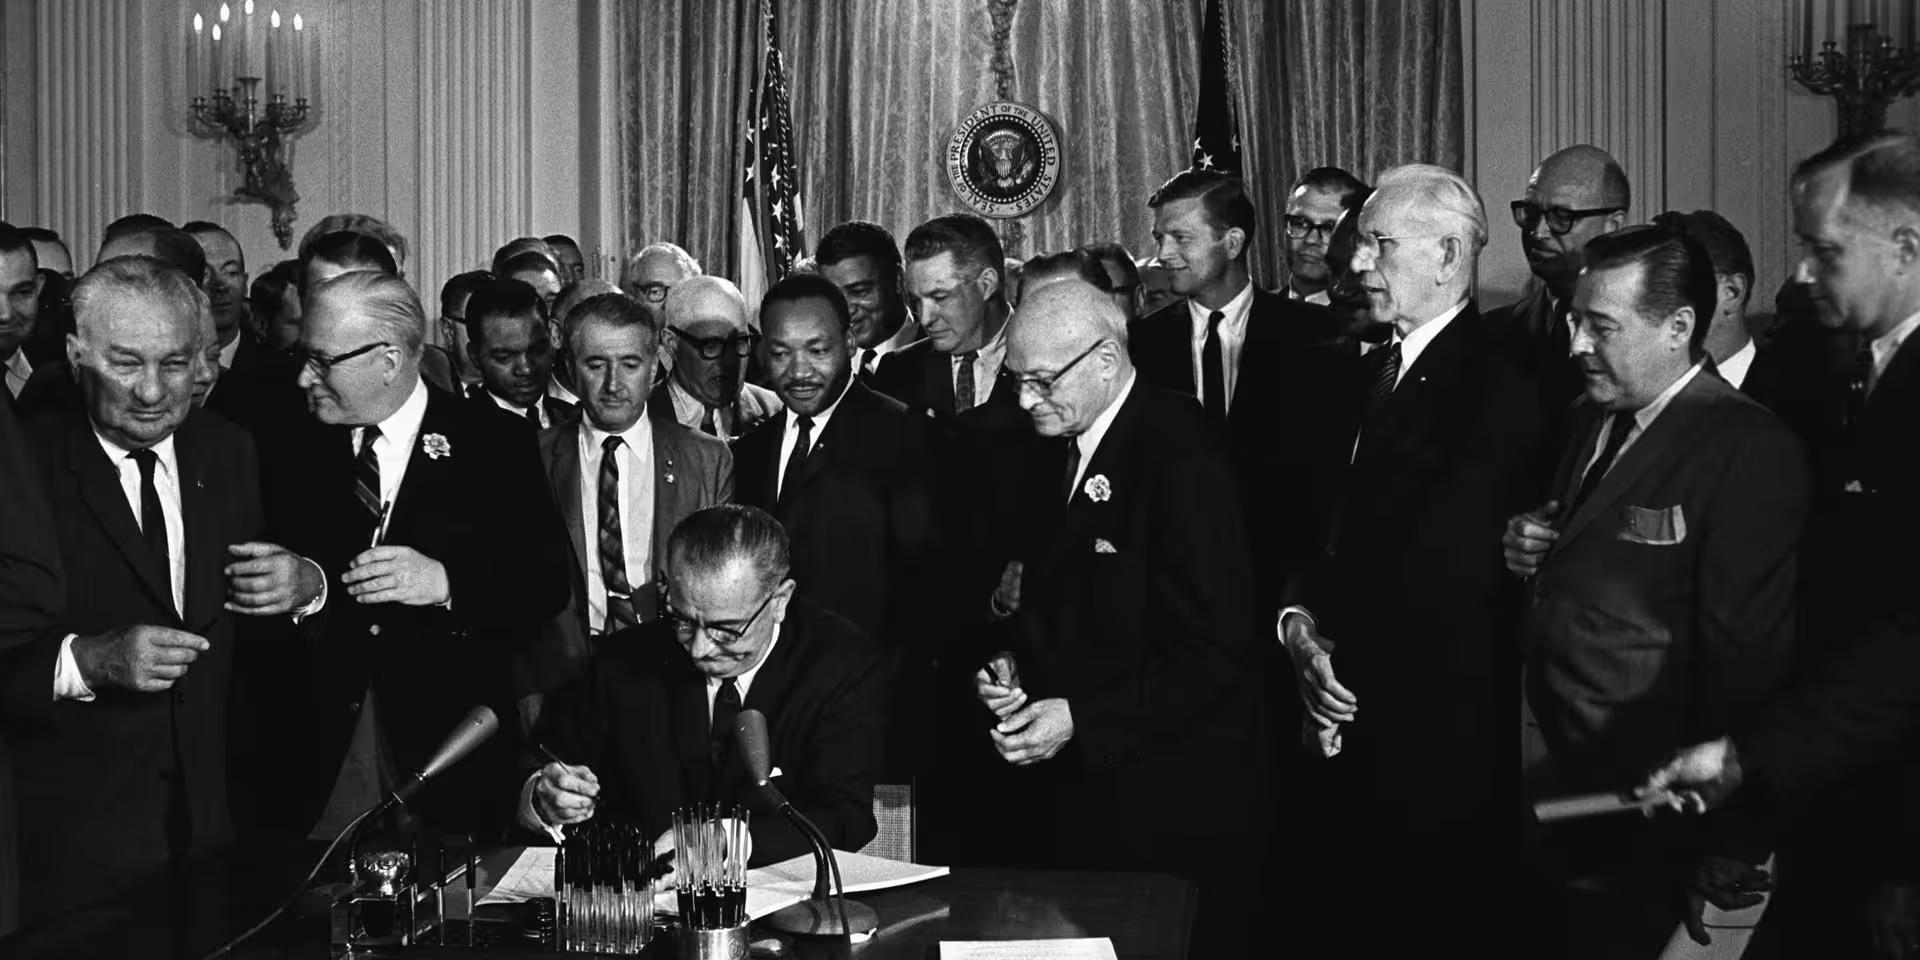
In addition to building codes, government regulations also require infrastructure to abide by standards. In the 1960’s, the civil rights movement addressed social inequalities and discrimination, including providing equal access and opportunities to public facilities, education, housing, employment, and the right to vote. In the 1960’s there was also a heightened awareness of protecting the environment, due increased understanding of environmental contaminates impacting ecosystem and public health and to notable environmental disasters such as the Cuyahoga River in Ohio catching on fire (US EPA Milestones). In response, the US Congress enacted several key civil rights and environmental policies and laws (See Figure 1.37).
A summary of a few of these laws and their relationship to the built environment are shown in Table 1.2.
| Date | Action | Description |
|---|---|---|
| July 2, 1964 | Civil Rights Act | Banned segregation according to race, religion, or national origin to business and public facilities including hotels and public schools and banned discrimination in employment |
| September 9, 1965 | US Department of Housing and Urban Development (HUD) | HUD created to provide affordable and fair housing, including public and assistend rental housing programs, and insurance for home mortages |
| April 11, 1968 | Fair Housing Act | "Prohibited discrimination concerning the sale, rental and financing of housing based on race, religion, national origin and sex"(HISTORY.COM Editors, 2010) |
| January 1, 1970 | National Environmental Protection Act (NEPA) | Federal government required to evaluate impact of projects on the environment |
| December 2, 1970 | US Environmental Protection Agency (EPA) | EPA created to administer environmental laws |
| December 29, 1970 | Occupational Safety and Health Administration (OSHA) | OHSA sets and enforce safety and health standards in the workplace |
| December 31, 1970 | Clean Air Act | Sets air quality standards and emission limits for polluters |
| October 18, 1972 | Clean Water Act | Sets waste water standards and national standards for water quality |
| December 28, 1973 | Endangered Species Act | Protects wildlife and plants that are threatned or endangered, including protecting habitat that could be disturbed or destroyed from large construction projects |
| December 16, 1974 | Safe Drinking Water Act | Establishes nationwide standards for drinking water |
| October 11, 1976 | Toxic Substances Control Act | Authorizes EPA to set standards and restrictions for toxics, leading nationwide standards banning lead paint, and mandadatory testing for asbestos and radon in public buildings |
| December 10, 1980 | Superfund Program | Authorizes EPA to require polluters to clean up contaminated sites or do so with government funds |
| July 26, 1990 | Americans with Disabilities Act (ADA) | People with disabilities are given equal opportunities, including providing wheelchair accessibility to transportation, parking lots, public buildings, and businesses open to the public. |
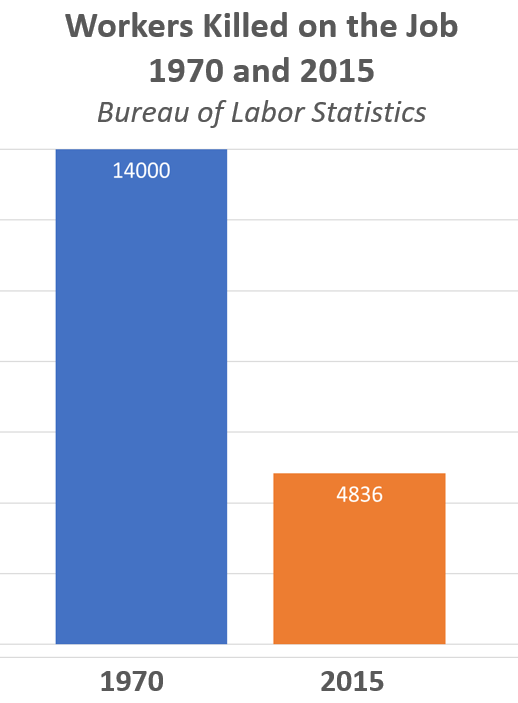
In many areas, the US has made substantial progress in making a more equitable, safer, and cleaner infrastructure. For example, Figure 1.38 shows that deaths have fallen by almost three times since 1970 when OSHA was passed and in 2015, even though the workforce nearly doubled in that time (Adams, Thompson, and Parker 2020).
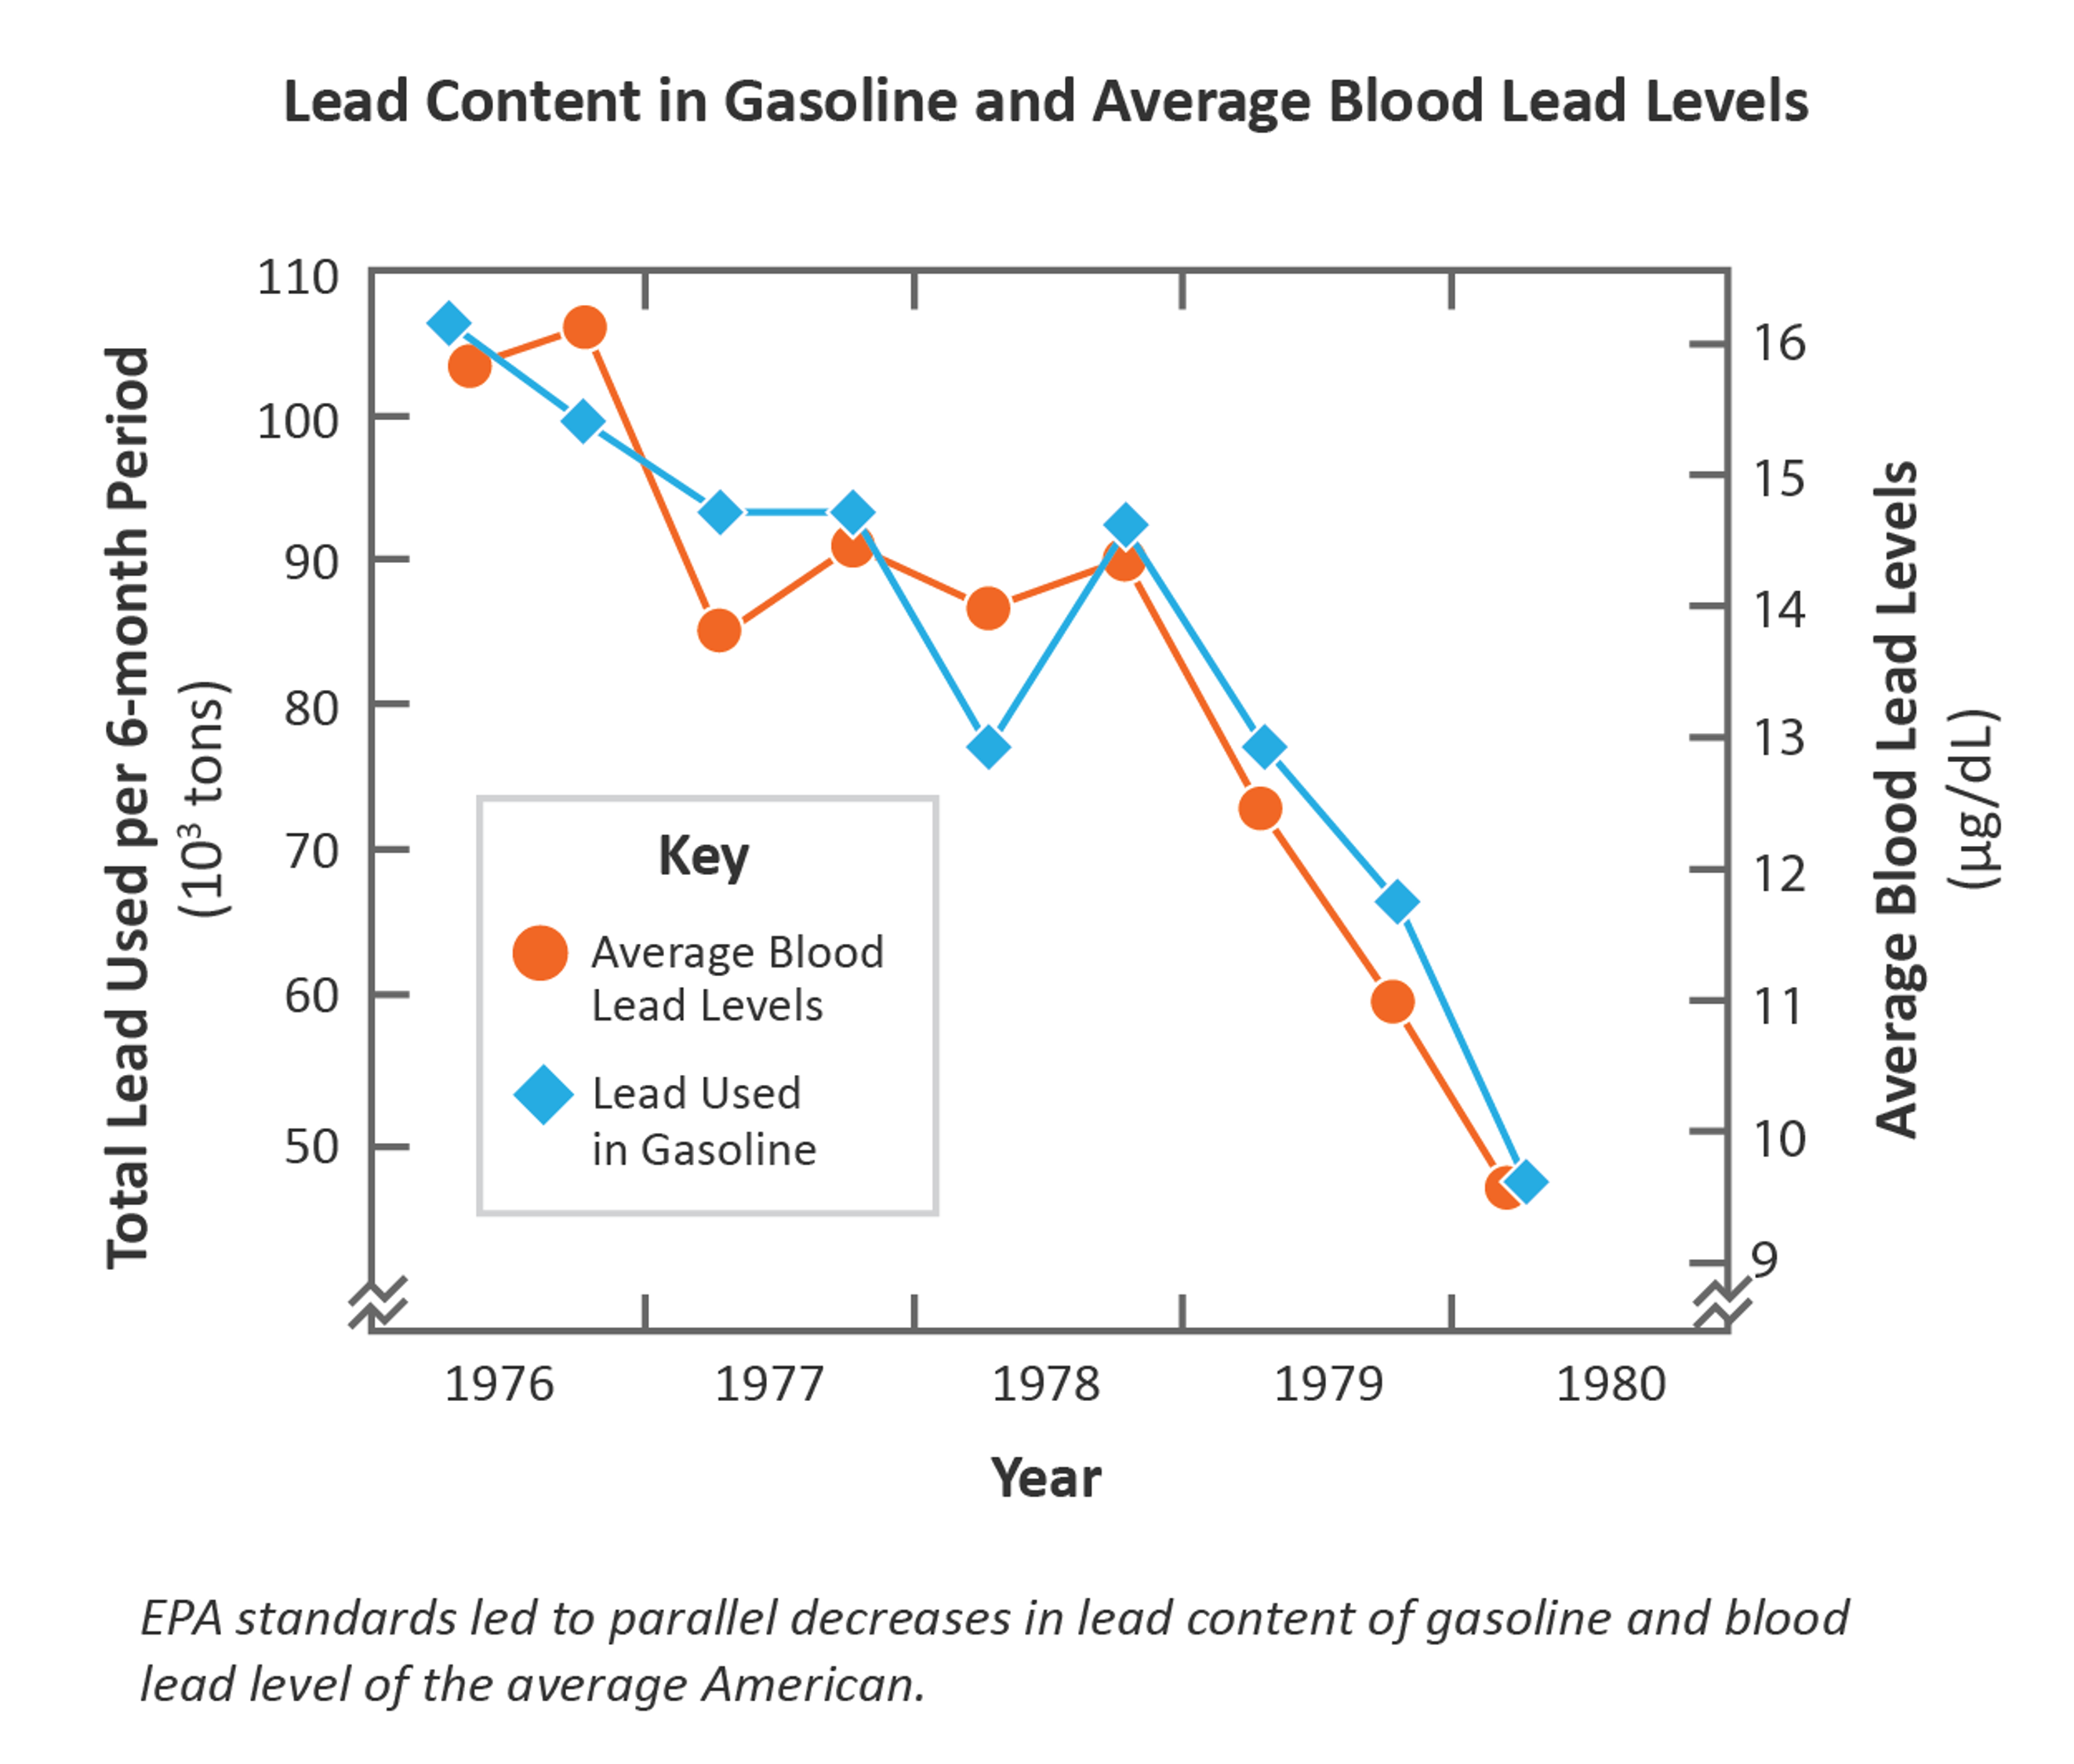
An example of an effective regulation to improve the environment and public health, is EPA’s regulation removing lead from gasoline with authority from the Clean Air Act. Lead impedes childhood development, including cognitive abilitiy. Average lead levels in children’s blood in the US used to be several times higher than clinical levels of concern, and decreased in parallel with lead use in gasoline as shown in Figure 1.39.
For many of these laws, the federal government delegates the authority to the States. For example, Utah, like many other states, implements their own occupational safety and health program, under the Utah Occupational Safety and Health Division (UOSH) to implement the OHSA standards and requirements. Another example, the State of Utah issues permits for Storm Water Pollution Protection Plans (SWPPP) (Utah DEQ 2025) as required by the Clean Water Act (US EPA 2025a) to protect streams and lakes from erosion from construction sites. State and local governments also pass many additional regulations regarding the build-environment (US EPA 2003).
1.8.3 NEPA
In this section, we summarize the analysis steps required to evaluate infrastructure projects under the National Environmental Policy Act (NEPA).
The National Environmental Policy Act (NEPA), the United States Congress “declared that it is the continual policy of the Federal Government … to create and maintain conditions under which humans and nature can exist in productive harmony, that permit fulfilling the social, economic and other requirements of present and future generations”(U.S. Code 2023).
In other words, NEPA is a law to pursue sustainability in the US government actions. In practice, NEPA is a federal law that requires all federal agencies to evaluate the environmental consequences of their proposals, document their analysis, and make the information available to the public prior to making decisions. This applies to direct actions by federal agencies, as well as indirect actions including all projects that use federal money or required a federal permit or regulatory decision — which includes most large civil infrastructure projects (Environmental Excellence | AASHTO (2024)).
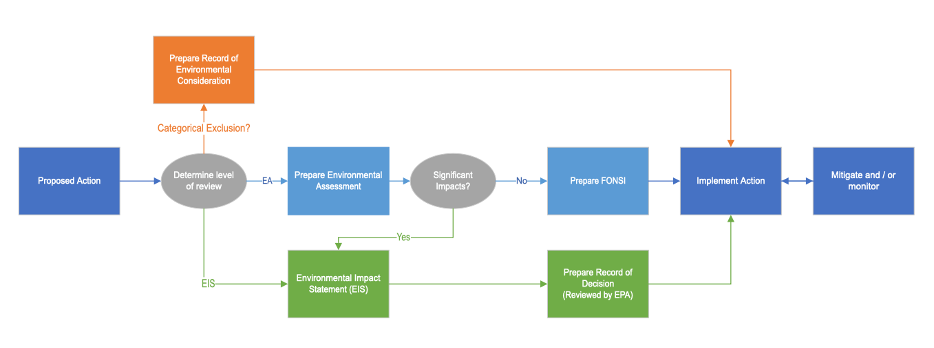
NEPA does not say that federal projects can have no environmental impact. It does say that the potential impacts must be known, they must be told to the public, and that an equivalent alternative with fewer environmental impacts could not be found. The process for ensuring that a project complies with NEPA is illustrated in Figure 1.41 and is as follows:
- The agency determines if the project falls under a Categorical Exclusion (CATEX). This happens when common projects have been previously determined to have no significant impact. For example, the Federal Highway Administration (FHWA), lists bike paths, resurfacing projects, and adding a passing lane within the existing right-of-way as projects with a CATEX (US DOT 2025). If a CATEX does not apply, then
- The agency conducts an Environmental Assessment (EA) to identify if there are any likely environmental impacts. If the EA determined that the impacts were minimal or negligible, then the agency issues a Finding of No Significant Impact (FONSI), and the project can proceed. If there is a potential for significant impact, then
- The agency prepares an Environmental Impact Statement (EIS). An EIS is a detailed analysis of all the alternatives considered across multiple dimensions that occurs in several stages.
- The agency publishes a “Notice of Intent” to inform the public that an EIS is about to occur, including its scope and purpose.
- The agency completes and publishes a draft EIS, which must be open for public comment for at least 45 days
- The agency completes the final EIS, which must respond to substantive public comment.
- The Environmental Protection Agency (EPA) reviews the EIS and issues a Record of Decision (ROD)
Large infrastructure projects are frequently targets of legal action under NEPA. For instance, if a community feels its needs were not adequately considered when a FONSI was issued in response to an EA, then the community may sue the funding agency; a court can then overrule the FONSI and require the agency to conduct a complete EIS. A court could also invalidate a ROD if it determined the EIS was conducted improperly, for instance if the EIS and subsequent ROD ignored the agency’s responsibilities under the Endangered Species Act or other federal legislation.
Unit Summary
God has given His children important gifts that enable us to change the environment around us and make it a better place for us to live. This lets us have longer, happier, and more fulfilling lives. At the same time, these blessings place on humans a responsibility to care for the earth and its resources. By implementing principles of economic, environmental, and social sustainability into the things we do and build, we can help to make sure that the earth will fulfill its purposes for God’s children.
This chapter has largely focused on the motivation for sustainable built environments. In future chapters you will learn social and organizational principles that can motivate people around you to solve big challenges, economic principles that make sustainability unnatural, and how to evaluate the life cycle costs of long-running built environment projects.
Study Guide
To prepare for an exam, consider the learning outcomes at the beginning of each section. If it asks you to discuss something, can you discuss it? If you need to list or identify a concept in order to discuss it, you should probably do that too. Memorize a useful definition for each term in bold.
This list is adapted from one written by George Handley in a presentation to BYU faculty.↩︎
Often people use the term carbon emissions interchangeably with greenhouse gas emissions, which primarily include \(CO_2\) and \(CH_4\) (both of which include carbon).↩︎
Often people use the term carbon emissions interchangeably with greenhouse gas emissions, which primarily include \(CO_2\) and \(CH_4\) (both of which include carbon).↩︎
because historians didn’t exist before urbanization started↩︎
1.3.3 Social
Our gospel perspective teaches us that all people are alike unto God. (2 Nephi 26:33). In striving to build a Zion community, we are concerned that we are all equal.
The social aspect of sustainability addresses the impact of infrastructure on people. The purpose of the build environment is to make our lives better. Does the infrastructure improve the well-being for society. Does it keep people safe by minimizing risks?
What happens when the built-environment improves the quality of life for some people, but degrades the quality of life for others? Built environments that fairly distribute the costs and benefits among different groups of people are considered socially sustainable.
Good questions to ask regarding social sustainability of a building project include:
Over 20,000 people died in the French effort to build the Panama Canal, mostly due to malaria and yellow fever. In the US effort, more than 5,600 people died due to disease and accidents during the US construction of the Canal. The burden was not shared equally. Of the deaths, only 350 were White Americans, the majority were workers from the West Indies (Wikipedia (2025), Linda Hall Library (2025)). Was the construction socially sustainable?
The canal provided work opportunities for thousands of people, albeit at extremely dangerous conditions. Today, the Panama Canal today provides facilitates trade across the world which provides enormous benefits. Was is worth the cost in human lives?
Unlike economic sustainability, social sustainable can be more difficult to numerically quantify and address. We will learn about approaches in Chapter 2 to quantify and address social sustainability.
1.3.3.1 Environmental Justice
Some infrastructure projects come with negative externalities — discussed in Section 3.4 — or unpleasant side-effects: train tracks and highways have lots of noise and pollution, and wastewater treatment plants often have unpleasant odors. Historically, engineers have located these facilities in low-value locations to save financial resources and benefit wealthier and more politicaly powerful citizens. But this often results in low-income and minority communities bearing the majority of these negative costs.
As shown in Figure 1.15, Black, Hispanic, and Asian Americans on average are exposed to higher concentrations of \(NO_2\) than White Americans. \(NO_2\) is a pollutant predominately emitted from motor vehicles. While average air quality, as measured with \(NO_2\) concentrations, has improved for all racial and ethnic groups between 1990 and 2010, the disparities in air quality still persist.
Another example is exposure to natural disasters. Historic segregation has pushed low-income and and minority communities into low-lying areas with increased flood risk (USGCRP 2023). These disparities are projected to continue into the future with the added risk of climate change (see Figure 1.16).
Environmental justice is a principle and a goal to address inequalities in environmental protection. Environmental Justice in encompasses both social and environmental sustainability. In 2023, the US Environmental Protection Agency defined environmental justice as
As we seek to encourage envronmental justice, we are also encouraging social and environmental sustainability.